Illustrative Mathematics
Weather Graph Data
Teaching young mathematicians about collecting and analyzing data allows for a variety of fun and engaging activities. Here, children observe the weather every day for a month, recording their observations in the form of a bar graph....
Curated OER
Storms and Extreme Weather
Students explore hurricanes and tornadoes by conducting an experiment. For this weather pattern lesson, students define many extreme weather vocabulary terms and discuss the relationship with static electricity. Students utilize plastic...
Curated OER
Charting the Weather
Students research and conduct non-experimental research, such as journals, the weather channel and the internet, to collect and record data for analysis on weather conditions in the United States and abroad. They identify, pronounce and...
Curated OER
Weather Dot Com
Students examine the need for a standard unit of temperature and measure temperature with a thermometer. They discuss the details of a thermometer and the calibrations used, record temperature data for inside and outside, explore...
Curated OER
Weather Forecasts
For this weather worksheet, learners view a weekly forecast for Bradford, United Kingdom and answer short answer questions about it. Students complete 7 questions.
University of Kansas
Newspaper in the Classroom
Newspapers aren't only for reading—they're for learning skills, too! A journalism unit provides three lessons each for primary, intermediate, and secondary grades. Lessons include objectives, materials, vocabulary, and procedure, and...
Curated OER
Egyptian Weather Lesson
Students chart temperatures in Egypt on spreadsheet to determine how weather conditions affect lifestyles.
Curated OER
Linking Algebra to Temperature
Students convert between two units as they calculate the temperature. In this algebra lesson, students collect data on seasonal climate and create a graph. They make conjectures based on their data collection.
US Apple Association
Apples: A Class Act! (Grades 4–6)
Middle schoolers have a bushel of fun as they engage in activities and research core facts about apples. Packed with suggestions for in-class activities and out-of-class research, the colorful 6-page packet is sure to satisfy hungry...
Curated OER
Comparing and Ordering Decimals
Which decimal is greater? Learners start by comparing eight pairs of decimals, writing in the symbol (> or <) to indicate values. The next two sections involve sets of three decimals. They start by circling the decimal with the...
Curated OER
Weather Chart
Students select at least 6 cities from around the world to keep track of their high and low temperatures over a period of time.
Curated OER
Rainforest Unit
Students investigate the Rainforest. In this Rainforest lesson, students research magazines, journals and the Internet to create a "Save the Rainforest" slogan. Students will record local rainfall amounts and create a graph comparing...
Curated OER
Measuring Wind Speed
Students study wind speed and collect wind speed data. In this wind speed lesson, students visit a website to learn about the local wind speed forecast for their week. Students discuss wind and wind speed. Students collect wind speed...
Curated OER
Twister Season Springs into Action
Students discover how weather conditions can give rise to severe storms and tornadoes. They study the different types of severe weather, how they can track conditions in their own neighborhood, and how to prepare for the worst.
Curated OER
Greenhouse Effect: Pop Bottle Experiment
Students explore global warming by conducting a weather experiment. In this greenhouse gas lesson, students define the greenhouse effect and the impact on our ozone layer. Students utilize a soda pop bottle, floodlight bulb, thermometers...
Curated OER
Climate Systems - Which Location Is Best For Me?
Students study the difference between weather and climate. In this climate systems lesson students search the Internet for the parts of the Earth's system, gather climate data and complete a challenge scenario.
Curated OER
How Wet Did It Get?
Students measure the rainfall/snowfall on the playground on a rainy/snowy day with a rain/snow gauge. They draw a bar graph representing the amount of water that fell and observe a satellite image of the clouds and local weather system...
Curated OER
Wave Math
Students identify the different factors affecting the size and shape of ocean waves. In this math instructional activity, students calculate wave speed and wavelength given a mathematical formula.
Curated OER
Clifford Learns About the Four Seasons and So Do We!
Students explore the seasons and months of the year through literature, math, art and movement. They identify the month of their birthday and in which season it comes. Students name the four seasons and they memorize a poem to recite the...
Yummy Math
Really Big Pumpkins
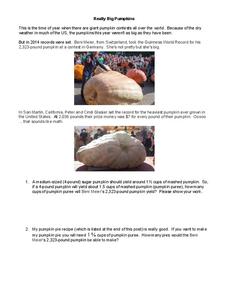
You may think your holiday pumpkins weigh a ton, but in a giant pumpkin contest, they actually do! Middle schoolers read about the winners of the 2014 giant pumpkin contests before solving three word problems involving multiplication and...
Curated OER
Web Adventure -- Oakland to Chicago Flight
Students develop an awareness of mathematics in a diverse number of careers, then describe three duties of a pilot that require mathematical skills. They increase understanding of interpreting data relationships presented in table format.
Curated OER
Use Temperature
In this temperatures worksheet, students read 7 clues and use their answers to fill in the temperature chart. All problems pertain to the rise and fall of temperatures in five cities.
Curated OER
Temperature High and Lows
Young scholars gather high and low temperature readings through email. In this temperature graphing activity, students use a spreadsheet to input data for a graph. young scholars interpret the graphs to compare and contrast the data from...
Curated OER
Subtract Positive and Negative Integers
Review the concept of subtracting positive and negative integers. Learners review the rules for subtracting integers, use manipulatives to visualize the process, and complete an assessment.
Other popular searches
- Kindergarten Weather Unit
- Second Grade Weather Unit
- Weather Unit Plan Clouds
- Fourth Grade Weather Unit
- Weather Unit Plans
- Severe Weather Unit
- Winter Weather Unit
- Geography Weather Unit
- Weather Unit Outlines
- Weather Unit Math
- First Grade Weather Units
- Local Weather Unit


