American Statistical Association
Scatter It! (Using Census Results to Help Predict Melissa’s Height)
Pupils use the provided census data to guess the future height of a child. They organize and plot the data, solve for the line of best fit, and determine the likely height and range for a specific age.
Curated OER
Assessing and Investigating Population Data
Students examine population projections. In this population data lesson, students research and collect data on the population of the United States. They explore and conclude future population growth patterns. Students construct tables...
Curated OER
A Picture is Worth a Thousand Words
Pupils create various types of graphs. They go to suggested websites to collect data and create graphs to organize the data. Then they answer questions according to their graph.
Curated OER
What's in a Number? Analyzing Smoking Statistics
Sixth and seventh graders analyze smoking statistics. In this health lesson plan, learners look at the percentage of people who smoke from each race group. They create a bar graph and circle graph that displays this information.
Curated OER
Drug Sales Soar: Bar Graph
In this graphs worksheet, students analyze a bar graph that shows retail prescription drug sales in the U.S. Students complete five problem solving questions about the data on the graph.
American Statistical Association
Bear Hugs
Scholars research arm span to determine who gives the best bear hugs. They use data from a national study to find the standard statistics for arm span. It includes mean, median, quartiles, spread, standard deviation, and more.
Education World
The African American Population in US History
How has the African American population changed over the years? Learners use charts, statistical data, and maps to see how populations in African American communities have changed since the 1860s. Activity modifications are included to...
Curated OER
Graphs! Graphs! Graphs!
Students practice making charts and graphs from data on spreadsheets. Individually, they create a graph representing the latest information on voter registration. They answer questions and analyze the data to end the instructional...
Bowland
Fashionista
So trendy! Show your class how to identify trends in sales patterns using mathematics. Scholars use a software simulation to collect data on age groups, price, and sales at a fashion store. This data allows individuals to determine the...
Curated OER
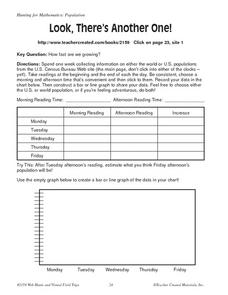
Look, There's Another One!
In this math worksheet, young scholars spend a week collecting information on either the word or U.S. populations from the U.S. Census Bureau Web site. Students record their data in a chart and bar graph. Young scholars also use the...
Curated OER
Time Changes Everything
Learners analyze census data from 1915, 1967 and 2006. They read an article about how the world's population is growing at an alarming rate. They use primary source documents to create a timeline on the information they gathered. They...
American Statistical Association
Armspans
Young mathematicians collect data on the arm spans of classmates. Then they sort the data by measures of center, spread, and standard deviation. Finally, they compare groups, such as boys and girls, to interpret any differences.
Curated OER
Census Sensibility
Young scholars examine the importance of the census and census data collection methods. They gather statistical data, create graphs comparing state and national populations, and compose written reflections on why the census is necessary.
Curated OER
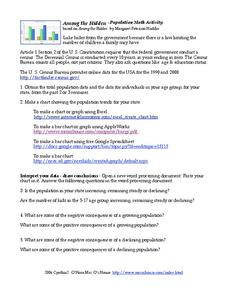
Among the Hidden - Population Math Activity
In this population worksheet, students collect data on population by researching the Census Bureau and then make online graphs and answer short answer questions about the data. Students complete 5 problems total.
Curated OER
Meatiest States: Graph Problem Solving
In this graph problem solving worksheet, students analyze a graph that shows commercial red meat production in five states. Students answer 5 word problems using the data on the graph.
Curated OER
Classroom Census
Students identify the processes involved in data collection. They decide how census data can be used. Students engage in the data collection process and represent and interpret classroom data. They use scattergrams, arrow diagrams, block...
Illustrative Mathematics
Electoral College
A cross-curricular resource that takes the electoral votes and allows your learners to organize and analyze the data. Young voters can determine which states are more influential and interpret the dotplot provided for more data....
Curated OER
Aboriginal Peoples
Young scholars examine data from the 2001 Census on the Aboriginal population. They cover the topics of distribution of the Aboriginal population across the country, the three Aboriginal groups, age, and language. Students build...
Curated OER
Problem Solving: Break a Problem into Parts
Learners work with the strategy of breaking a problem into parts in order to solve it. They write an expression with parentheses for each of the first three problems, and solve the problem, and use information from a table to answer the...
Curated OER
Drug Sales Soar - Rate of Change
In this prescription drug worksheet, learners answer short answer questions and create graphs on the sales of prescription drugs over a five year span. Students complete six questions.
Curated OER
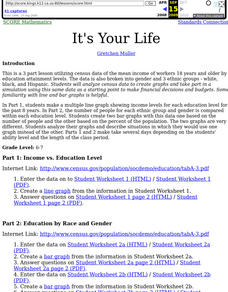
It's Your Life
Students make a multiple line graph showing income levels for each education level for the past 8 years and the number of people for each ethnic group and gender is compared within each education level.
Curated OER
Do Vampires Really Exist?
Students identify and extend a number pattern into very large values. They create and interpret a graph based on their number patterns. Students compare a math model with real-world statistics about the existence of vampires.
Curated OER
Word Problems: "Leaving D.C."
In this solving math story problems learning exercise, students read statistics from the Student edition of USA Today to solve word problems. Students solve 6 problems.
Curated OER
I'm Late, I'm Late, for a Radioactive Date!
Through the use of an interactive Web site, students explore C-14 and C-14 dating. Then students analyze an article written about the C-14 dating of the Shroud of Turin and draw conclusions.


