Newspaper Association of America
By the Numbers: Mathematical Connections in Newspapers for Middle-Grade Students
A cross-curricular resource teaches and reinforces mathematical concepts with several activities that use parts of a newspaper. Scholars use scavenger hunts to find the different ways math is used in the paper along with using data...
Curated OER
Tourism in London
Students discuss the tourist attractions that are in London. They examine how data can be manipulated by completing a worksheet. They plan a trip to a London attraction after conducting Internet research.
Curated OER
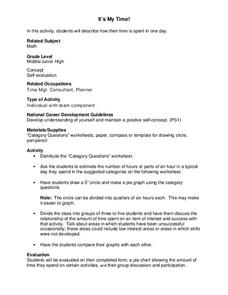
It's My Time!
Students create a pie chart. In this time lesson, students determine the amount of time they spend on given activities. They create a pie chart diagraming the data. Students share their graphs with the class.
Curated OER
More Jelly Bean Math
Students use their color categorized jelly beans to find the range, mean, median and mode. They use their recorded data documenting how many jelly beans there are for each color in order to calculate the range, mean, median and mode of...
Curated OER
Snack Attack
Learners design charts, tables, graphs, and pictographs to analyse the types of snacks in a bag.
Texas Instruments
Data Collection for Bar Graphs
Learners study the concept of central tendency in this data collection for bar graph instructional activity. They collect data outside as instructed and organize it into a bar graphs, then they list in specific groups the labels that...
Curated OER
Applied Science - Built Environment Lab
Students evaluate trash. In this Science lesson, students collect and weigh trash from their classrooms. Students categorize the trash and the corresponding weights, recording the information on a data sheet.
Curated OER
Count The Letters
Students perform activities involving ratios, proportions and percents. Given a newspaper article, groups of students count the number of letters in a given area. They use calculators and data collected to construct a pie chart and bar...
Curated OER
Rules of the Roll
Students roll a ball down a plank and measure the distance it travels. Students graph the distances the ball travels as they change the height of the incline (increase slope).
Curated OER
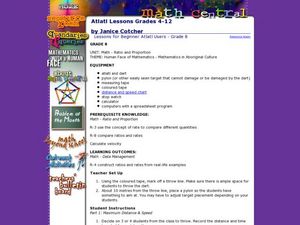
Atlatl Lessons Grade 4-12
Students experiment with velocity, ratios, and rates. In this data management lesson plan, students throw a dart with and without using an atlatl and collect and record various data. Students construct ratios based on the data and...
NOAA
Sustaining Our Ocean Resources
Lead young scientists on an investigation of fishery practices with the final installment of this four-part unit. Using a PowerPoint presentation and hands-on simulation, this instructional activity engages children in learning how fish...
Curated OER
Shedding Light on the Weather with Relative Humidity
Learners study weather using a graphing calculator in this instructional activity. They collect data for temperature and relative humidity for every hour over a day from the newspaper, then place the data in their handheld calculator and...
Curated OER
Environmental Responsibility
Students discuss the importance of recycling and preventing pollution. In groups, they complete mini-studies on various environmental issues and evaluate different consumer products. They use global warming data to determine the...
Curated OER
Time Management
Students record their daily activities and graph the results using the educational software program called Inspiration. This instructional activity is intended for the upper-elementary classroom and includes resource links and activity...
Visa
Money Responsibility
Introduce young learners to the important life skill of responsibly managing money and recording how much they spend and save.
Bowland
AstroZoo
Rescue animals in the zoo by applying math concepts. Groups of learners solve three missions involving oxygen, food, and climate control. Each group selects an animal from one of four bio-domes.
Curated OER
Wolves
Students explore wolves. In this ecology and wolves lesson, students research predator-prey relationships on the Internet and complete a related worksheet with a partner. Students interpret data on bar graphs to determine growth and...
Curated OER
West Nile Virus and Lyme Disease: Making Sense of the Numbers
In an interdisciplinary exploration, trace the development of West Nile fever and Lyme diseases. Pupils discover how these diseases are contracted. They collect statistical data and analyze trends.
Curated OER
Involving Community Members, Parents, and Community Agencies in Student Learning
Students predict and estimate the number of moose shot by people between the years of 1986-1990. They analyze data and statistics, construct bar graphs, and conduct research on the Alaskan moose.
Curated OER
Mean, Median, Mode and Range
Sixth graders identify the mean, median, mode and range in a given set of data. Using a specified website, they use their skills to play the game, "Train Race" where students find the mean, median, and rage of information to help the...
Curated OER
Taste the Rainbow
Students practice estimating and graphing by utilizing Skittles. For this statistics lesson, students complete worksheets based on the likelihood of a certain color of skittle coming out of the bag. Students create a graph based on the...
Curated OER
Spaghetti Bridges: Student Worksheet
In this math worksheet, students will create a "bridge" out of spaghetti and test it's strength with pennies. Students will record their results on a table and then graph the results.
Curated OER
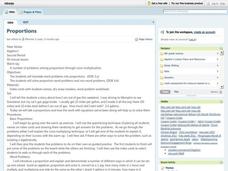
Proportions
Students examine the mathematical concept of proportions in an attempt to apply them in various types of problems. The real application of proportions is often found in word problems which requires a them to also practice a systematic...
Curated OER
Altering a Plant Environment
Students investigate what a controlled group is by creating an experiment. In this plant growth lesson, students identify the different parts of a plant and discuss what is needed for a plant to be successfully grown. Students grow a...


