Curated OER
What Are Erosion and Sediments?
Students create experiments in class based on the erosion of Earth. In this erosion lesson, students perform a lab in class replicating the effects of erosion. Students finally draw their own conclusions based on the research performed.
Curated OER
Tall Tale Rollers
Students explore American tall tales. In this tall tale lesson plan, students discover the six characteristics that are included in tall tales. Students survey their class to find each student's favorite tall tale character and organize...
Pennsylvania Department of Education
Equal Groups
Students explore statistics by completing a graphing activity. In this data analysis lesson, students define a list of mathematical vocabulary terms before unpacking a box of raisins. Students utilize the raisins to plot data on a line...
Curated OER
Origami Flight: The Physical Setting
Sixth graders investigate the forces that move certain objects. In this physics lesson, 6th graders design and create paper flying objects using origami methods, which they practice flying in different conditions. Students record and...
Curated OER
In the Forecast, a Flurry of Concerns about Snow
Students consider the effects of climate change on snowfall and how a lack of data in snowfall collection impair climate change research. They, in groups, investigate different effects of snowfall and make recommendations to lobbyists.
Curated OER
Taking a Stand: Pros and Cons of Forest Fires
Students explain the components of fire, explain how forest fires impact man and the environment, analyze data in order to recognize areas that are at risk for forest fires, make recommendations based on research.
Curated OER
Canada and its Trading Partners
Students identify the relationship between Canada and its trading partners. They use two data sources, Canadian Statistics and E-STAT, on the Statistics Canada website to explore the growing importance of trade in general.
Curated OER
Coin Count & Classification
Students make a prediction about how 100 pennies sort by decade or year and then test their predictions. They organize their data using a graph that is imbedded in this lesson.
Curated OER
Apple Estimation: Percentages & Subjective Reasoning
Students practice using their estimation skills by utilizing apples. In this percentage lesson, students utilize a scale and an apple to discover the percentage of each bite they take. Students share their data with the rest of the...
Curated OER
Human Fingerprints: No Two the Same
Sixth graders explore scientific observations by analyzing a group of data. In this fingerprint identification instructional activity, 6th graders identify the reasoning behind fingerprinting and create their own ink fingerprints....
Curated OER
Pocahontas: One Foot in Two Worlds
Students draw upon the visual data presented in photographs, paintings, cartoons, and architectural drawings in order to clarify, illustrate, or elaborate upon information presented in the historical narrative.
Curated OER
What Are the Layers of the Rain Forest?
Young scholars investigate the different levels of the rain forest by comparing it to an apartment. In this ecology lesson, students practice using forest related vocabulary words and complete a vocabulary data sheet. Young scholars...
Curated OER
Ted Hughes "Pike"
Students analyze how a poet uses language to capture creatures and draft a poem on a 'sinister' animal. In this poetry analysis lesson, students read Ted Hughes' poem 'Pike' and analyze pictures of pike fish. Students use their research...
Curated OER
Feature Analysis
Students research and analyze energy. In this energy lesson plan, students research types of energy and complete a feature analysis chart using chalk or markers. Students write generalizations about each type of energy based on their chart.
Curated OER
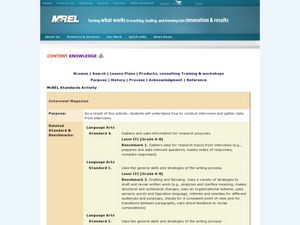
Interview! Magazine
Students interview a subject and write a biographical sketch for a fictional magazine. In this interview lesson, students choose a person to interview and create two sets of questions. Students conduct the interview. Students then write...
Curated OER
Seed Germination
Learners explore plants and the scientific method. In this plant growth instructional activity, students follow the steps in the scientific method to perform a seed germination experiment as a whole class. Learners work in a group to...
Curated OER
The Appearance of a Graph
Sixth graders understand that the appearance and increment used on the x and y axis in a graph change how it looks. In this graphing instructional activity, 6th graders work in pairs and interpret graphs using different axes. Students...
Curated OER
Variable Skies
Students examine factors which affect a vortex and create model tornadoes. They identify variables, pose a testable question, and perform an experiment using the scientific method. After they collect their data, students write a complete...
Curated OER
Standards and Measures
Students conduct a "one-question interview" about standardized tests. They assess two sections of a standardized test that they took or will take this year and write an article for their school newspaper that consolidates their test...
Curated OER
Its OK To Be a Clod
Students describe factors that affect the solubility of a chemical substance in seawater. In this sea environment lesson plan, student explain how information on the solubility of a substance can be used to measure water currents. They...
Curated OER
How Much Will I Spend On Gas?
Students construct a linear graph. In this graphing lesson, students determine a monthly budget for gasoline. Students construct a t-chart and coordinate graph to display data. Resources are provided.
Curated OER
Body Measuring Activity
Young scholars explore geometry by participating in a measurement activity. In this human anatomy lesson plan, students identify the appropriate methods to measure human body parts and do so in class. Young scholars create a bar graph...
Curated OER
Force and Gliders
Students explore physics by creating data graphs in class. In this flight properties lesson plan, students read the book Flying Machine and identify the force, resistance and construction necessary to keep a glider in the air. Students...
Curated OER
The Coyote Population: Kansas Prairies
Students discover animal lifestyles by researching their ecosystem. In this animal statistics lesson, students research the geography of Kansas and discuss the reasons why wild animals survive in the open Kansas fields. Students complete...
Other popular searches
- Data, Census, & Statistics
- Data Analysis Pictograph
- Data Table
- Categorical Data
- Data Analysis Lesson Plans
- Data Management
- Data Analysis Graphing
- Data Analysis and Graphs
- Science Fair Project Data
- Data Display
- Organizing Data
- Census Data


