Curated OER
Metrically Me!
Students define the parts of a database, search strategies to locate information electronically, create/modify databases, etc. and enter data into a prepared spreadsheet to perform calculations.
Curated OER
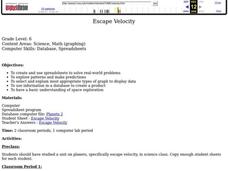
Escape Velocity
Sixth graders create/use spreadsheets to solve real-world problems, explore patterns, make predictions, select/explain most appropriate types of graph to display data, use information to create product, and have basic understanding of...
Curated OER
Kinzi Deaf Alumni
Learners use data of school alumni to create a database. The lesson plan uses technology and access to a computer lab is essential. The concepts of graphing statistics is also used to help teach across the curriculum.
Curated OER
Get Ready For Some Football
Sixth graders compare and contrast the totals from two national football teams for the year. Using the internet, they search for the information they need and create a data bar graph. They use the information they collected to answer...
Curated OER
Fantasy Baseball Team
Students create a database and use its ability to store, sort, and present information about their fantasy baseball team. They gather information and use their knowledge of statistics to accomplish their team.
Curated OER
Birds, Fractions and Percentages
Students study fractions, percentages, spreadsheets, and computers by watching and recording the number of species of birdsseen. They create a spreadsheet to record the results of their one month study.
Curated OER
Creating a Bar Graph with a Graphing Program
Students use the S'COOL data base to create a bar graph.
Curated OER
The Wonderful World of Trees
Sixth graders identify trees by observing their structure and shape. They particiapte in taking pictures of trees with a digital camera and using these pictures in an electronic presentation where they creat a database with this...
Curated OER
Pumped Up Gas Prices
Students calculate gas prices. In this transportation lesson plan, students tally the mileage and gas costs of their car for one months. They figure out how much was spent on gas and create a graph showing average gas prices over time.
Curated OER
Sweet Data
Students input data about the colors of their serving of M&M candies onto a spreadsheet. They create charts and graphs based on this information.
Curated OER
The Hot Dog Stand - An Annual Report
Middle schoolers run a computer simulation and collect data as they work and use the data to create an annual report for their business. It is desirable for students to do this project individually, but it could be done as a class using...
Curated OER
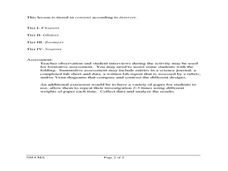
Origami Flight: The Physical Setting
Sixth graders investigate the forces that move certain objects. In this physics lesson, 6th graders design and create paper flying objects using origami methods, which they practice flying in different conditions. Students record and...
Curated OER
Excel temperature Graphs
Students gather data about the weather in Nome, Alaska. In this Nome Temperature lesson, students create an excel graph to explore the weather trends in Nome. Students will find the average weather and add a trend line to their graph.
Curated OER
Enrichment Project
Students create enrichment activities for Geoboards, Napier Rods, and Bean Sticks. This includes annotated links to problem solving Internet Sites.
Curated OER
I'm Out of Here
Students create a travel budget. In this budget lesson, students research vacation destinations. Working independently, students research destinations on the Internet and construct a budget for the vacation. Resources provided.
Curated OER
Mathematical Magazines
Students look through magazines and calculate the percentages of the types of ads in the magazines. In this percentages lesson plan, students create a graph to show their results.
Curated OER
Is That a Plan? Problem-Solving: Using Diagrams and Models
Student solve problems using a flow chart. They solve real-world problems by using a diagram or model. They create their own diagrams for problem-solving. They explain how they drew the diagram and solved the problem.
Curated OER
Which Graph is best?
Pupils use commercial software to organize and visually display data to draw conclusions; students use graphing software to create several types of graphs illustrating the number of each color of M&M's in one bag.
Curated OER
Finding Mean, Mode and Median in the Computer Lab
Students create spreadsheets which will display and figure mean, median, and mode of a set of numbers.
Curated OER
Doing The School Run
Pupils explore finding the percent of a numbers. They survey their peers to determine modes of transportation used in getting to school. Afterward, students organize information and create graphs and charts. They explore alternative...
Curated OER
Toy Planet
Students design a toy store, supply it with merchandise (on paper) and create advertisements. They also manage the store's debits and credits by using a spreadsheet. They consider how to promote the sale of their merchandise.
Curated OER
How Many M&M's
Students explore sets and collections. Students find the colors of M&M's and the amount of M&M's each student has. They organize this information into an Excel spreadsheet. Students use the chart wizard to create a graph.
Curated OER
Let's Plot Points
Use coordinate grid paper to plot points and identify shapes that are already plotted on the paper by saying their coordinates. Pupils also measure the distance between points and play the game Battleship. There are several web links and...


