Curated OER
Weather instruments
Students explore weather instruments. In this weather lesson, students make rain gauges, anemometers, and barometers following the instructions given in the lesson. Students set up a weather station using their instruments and record and...
Curated OER
Graphing and Analyzing Biome Data
Students explore biome data. In this world geography and weather data analysis lesson, students record data about weather conditions in North Carolina, Las Vegas, and Brazil. Students convert Fahrenheit degrees to Celsius degrees and use...
Curated OER
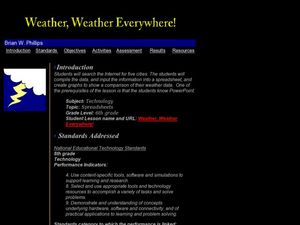
Weather, Weather, Everywhere!
Sixth graders collect weather data to compare temperatures around the world. Using the Internet, learners collect data, put it into spreadsheets, and analyze and graph the results. An interesting way to cover the topic of weather.
Living Rainforest
Finding the Rainforests
From Brazil to Indonesia, young scientists investigate the geography and climate of the world's tropical rain forests with this collection of worksheets.
Curated OER
Graphing the Forecast-Line Graph or Bar Graph?
Young scholars explore bar and line graphs. In this data collection, graphing, and weather lesson plan, students compare bar and line graphs and discuss which type of graph would be most appropriate for displaying a ten day weather...
Curated OER
Integers in the Weather
Middle schoolers engage in a clever lesson that combines meteorology with mathematical thinking. They use integers in relation to high and low temperatures that they record. They use a spreadsheet of weather data, a computer, and gain...
Curated OER
Frost Depth Study
Students complete activities to study the frost and frost depth. For this frost study lesson, students use frost tubes to study and measure the frost at their school. Students measure the frost in the tube and enter their data online to...
Curated OER
Sweethearts and Data Analysis
Students explore the concept collecting and representing data. In this collecting and representing data lesson, students record the different colors of sweetheart candies in their sweethearts box. Students create a table of the data and...
Curated OER
Shedding Light on the Weather with Relative Humidity
Learners study weather using a graphing calculator in this instructional activity. They collect data for temperature and relative humidity for every hour over a day from the newspaper, then place the data in their handheld calculator and...
Curated OER
Do the Elephants Need Sunscreen? A Study of the Weather Patterns in Etosha
Students analyze the weather patterns in Namibia. They create a graph of the yearly temperatures and use the internet to gather information. They discuss how the weather goes in cycles in the area.
Curated OER
Conditions at Sea Introductory Activity, Making Waves
Students explore waves and wind. In this physical and earth science wave lesson, students participate in a wave making activity with an aquarium and a hair dryer. Students complete a data chart recording wave height and related factors....
Curated OER
Graphing the Forecast - Line Graph or Bar Graph?
Sixth graders compare and contrast bar and line graphs. Using a weather forecast of the area, 6th graders record the high and low temperatures in a table. Students determine and justify the most appropriate graph to display a given set...
Curated OER
Excel temperature Graphs
Students gather data about the weather in Nome, Alaska. In this Nome Temperature lesson, students create an excel graph to explore the weather trends in Nome. Students will find the average weather and add a trend line to their graph.
Curated OER
Weather Tools
Students explore Earth science by participating in a weather identification activity. In this scientific instrument lesson, students identify several weather related tools such as the weather vane, thermometer and rain gauge. Students...
Curated OER
Under the Weather
Students review mean, median, mode, and range while using the newspaper to answer weather questions.
Curated OER
Probability
Sixth graders explore the concept of probability. In this probability lesson, 6th graders collaborate to collect spinner data based on the likelihood of spinning odd and even numbers. Students complete 2 other probability activities and...
Curated OER
Surface Meteorological Observation System (SMOS)
Students monitor local surface weather conditions for at least 30 days. They interpret the data by graphing it and detemining percentages.
Curated OER
Temperature High and Lows
Young scholars gather high and low temperature readings through email. In this temperature graphing activity, students use a spreadsheet to input data for a graph. young scholars interpret the graphs to compare and contrast the data from...
Curated OER
How Oceans Affect Climate
Students draw conclusions about how the ocean affects temperature. In this weather instructional activity, students use the Internet to gather data to help them come to a conclusion about how the climate in a certain region is directly...
Curated OER
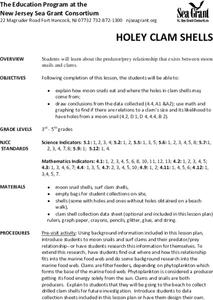
Holey Clamshells
Pupils analyze data to make hypotheses and conclusions regarding the predator/prey relationship between moon snail and surf clams.
Curated OER
Probability: The Study of Chance
Students practice the basic principles of probability by conducting an experiment, determining if a game is fair, collecting data, interpreting data, displaying data, conducting analysis, and stating and applying the rule for probability.
Curated OER
Trouble in the Troposphere
Learners Use data sets from MY NASA DATA to produce graphs comparing monthly and yearly ozone averages of several U.S. cities. They analyze and evaluate the data and predict trends based on the data. In addition, they discuss and...
Curated OER
Weather Chart
Students select at least 6 cities from around the world to keep track of their high and low temperatures over a period of time.
Curated OER
What's up with the weather?
Middle schoolers use the weather as a context for collecting data and making interpretations based upon the observations. The scientific method is also taught to give them a way to conduct the data collection.


