Curated OER
Raisin the Statistical Roof
Use a box of raisins to help introduce the concept of data analysis. Learners collect, analyze and display their data using a variety of methods. The included worksheet takes them through a step-by-step analysis process and graphing.
Curated OER
Visual Representation of Reduced Fat
Students demonstrate their understanding of the Five-Number Summary and Box-Plots by analyzing different nutrition labels from regular and reduced fat items using graphing calculators.
Curated OER
Stats on Reduced-Fat
Students demonstrate an understanding of the Five-Number Summary and Box-Plots after analyzing data from nutrition labels, forming a hypothesis and supporting it. They decide if there is a significant difference between reduced fat and...
Mathematics Assessment Project
Middle School Mathematics Test 4
Raise expectations in your classroom and assess learners through the provided performance tasks. Class members must apply concepts learned throughout the year, providing a good measurement of how well they understand the material. The...
Mathematics Assessment Project
Middle School Mathematics Test 3
Real-life mathematics is not as simple as repeating a set of steps; pupils must mentally go through a process to come to their conclusions. Teach learners to read, analyze, and create a plan for solving a problem situation. The provided...
Curated OER
What Color Are Your Eyes?
In this color of eyes worksheet, students conduct a survey to determine the number of students who have brown, hazel, blue or green eyes. The information is collected and then the data is organized. Students may use the data to create...
Los Angeles County Office of Education
Assessment for the California Mathematics Standards Grade 7
In need of an all-inclusive seventh grade math resource? Packed full of the topics necessary for Pre-Algebra the packet includes practice problems with different difficulty levels. It works great for any supplemental use needed in the...
Curated OER
LAND USE ISSUES
Students relate math with real life situations. They identify and plot points on a grid map. They identify and locate the Drop Box Sites.
Curated OER
Coordinates
In this coordinates worksheet, students analyze two maps and identify the coordinates of ten specific locations. Students plot sixteen points on a graph and check their answers online at the end of each exercise.
Curated OER
Practice: Word Problems
Congratulations, you've just hit the word problem jackpot! Covering an incredible range of topics from integers and fractions, to percents, geometry, and much more, this collection of worksheets will keep young mathematicians busy...
Curated OER
Cumulative Frequency
In these word frequency worksheets, students choose a page from a newspaper and count the number of letters in each word and complete their results in a table. Students then calculate the mean number of letters. Students then collect...
Helping with Math
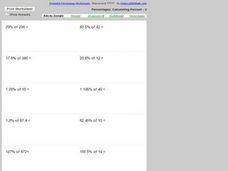
Percentages: Calculating Percent - 2
Here is a worksheet on which math classes practice calculating the percentage of different numbers. Some of the percentages involve decimals, so this would not be an assignment for first-time percent calculators! You can print the...
Curated OER
Raisin Cane
Students estimate and record the number of raisins in a snack-size box. They also graph their results and note the differences (+ or -) from their estimate and actual number.
Curated OER
Ornithology and Real World Science
Double click that mouse because you just found an amazing lesson plan! This cross-curricular Ornithology lesson plan incorporates literature, writing, reading informational text, data collection, scientific inquiry, Internet research,...
Curated OER
Get a Half Life!: Student Worksheet
Upper elementary or middle schoolers will explore non-linear functions, graphing, and the curve of best fit through real-life data collection and trial analysis. They explore the concept of half-life and radioactive decay using M&Ms,...
Curated OER
Incredible Integers!
There are three parts to this lesson on integers. In the first, learners explore positive and negative numbers on an actual painter's tape number line and by playing a "Hot Seat" game. In part two, they view a BrainPop video and work...
Curated OER
Histograms and Bar Graphs
Students are introduced to histograms, bar graphs, and the concept of class interval. They use an activity and three discussions with supplemental exercises to help students explore how data can be graphically represented (and...
National Security Agency
Line Graphs: Gone Graphing
Practice graphing and interpreting data on line graphs with 36 pages of math activities. With rationale, worksheets, and assessment suggestions, the resource is a great addition to any graphing unit.
Curated OER
The Hot Dog Stand - An Annual Report
Students run a computer simulation and collect data as they work and use the data to create an annual report for their business. It is desirable for students to do this project individually, but it could be done as a class using a large...
Curated OER
Which Amusement Park Would You Choose?
Learners analyze data related to amusement parks and create a spreadsheet to display the data. They read the data and predict which amusement park they think is safer, create a spreadsheet and graph, and write a proposal based on their...
Curated OER
Graph it!
Sixth graders view a Stacked Graph, and discuss what it shows. Students discuss the basics of graphing: labels, intervals, legends x and y axis... Students create individual stacked graphs from provided information. Students view a...
Curated OER
Get a Half-Life!: Student Worksheet
In this math/science worksheet, students will work in pairs to conduct an experiment based on a decay function which is often used to model radioactive decay. Students will shake M & M's in a cup to rub off the M and then record...
Curated OER
New York State Testing Programs Mathematics Test
In this math worksheet, students review algebraic and geometric concepts as they review for the final exam of 6th grade. There are 35 questions.
Curated OER
MOBILITY, Traveling Lightly: What’s My Footprint?
Students calculate their carbon footprint. In this environmental technology lesson, students listen to a lecture on climate change. Students brainstorm solutions to reduce environmental impact based on travel options. Students calculate...
Other popular searches
- Analyzing Box Plots
- Outliers Box Plots
- Interpret Box Plots
- Graphs Box Plots
- Analysing Box Plots
- Leaf Box Plots
- Statistics Box Plots
- Conclude Box Plots
- Box Plots Worksheets
- Double Box and Whisker Plots
- Scatterplot Box


