National Woman's History Museum
Getting with the Program
A seven-step lesson introduces the emergence of computer sciences and the contributions women made to the profession after World War II. Several science experiments offer pupils a hands-on learning experience that showcases parabolas,...
Curated OER
What's Your Favorite? Survey And Graphing Project
Sixth graders create and edit spreadsheet documents using all data types, formulas and functions, and chart information. They collect and organize data that be portrayed in a graph that they create using EXCEL.
Curated OER
Converting Units and the SR-71
Students practice solving problems logically. Using the internet, students observe pictures and facts about the SR-71 Blackbird. They convert statistics about the aircraft. Students explore terms of flight and convert them to everyday...
Curated OER
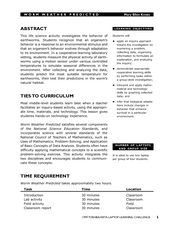
Worm Weather Predicted
Students examine worm habitats. In this animal habitats lesson plan, students participate in a lab activity that requires them to explore the adaptations that earthworms make to their environment.
Curated OER
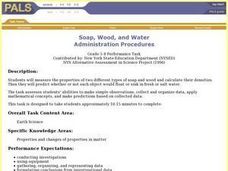
Soap, Wood, and Water
Students measure the properties of two different types of soap and wood and calculate their densities. Then they predict whether or not whether or not each object would float or sink in fresh or salt water.
Curated OER
Tower Power
Students explore basic building and engineering concepts by constructing a structure that supports weight. They demonstrate an understanding of basic business concepts by estimating the cost and value of a building.
Curated OER
Will There be Enough Water?
Students investigate water usage, water available, and water demand historically in the local area. They use projections of water usage, availability and demand up to the year 2050. Students use graphs to relate as well as compare and...
Curated OER
Density of Minerals
Students determine the mass, volume, and density of two different mineral samples. Students show data and calculations as well as answer questions about the mineral identities.
Curated OER
Roman Numeral Math
Students solve math problems using Roman numerals. In this roman numerals lesson, students use suggested websites to develop an understanding of Roman numerals and solve simple addition equations. Students create a chart of Roman...
Curated OER
Jazz and Math: The Beat Goes On
Young scholars collect real data through listening, counting and timing jazz pieces.They use ratios, rates, and proportions to report collected data and demonstrate an understanding of the concepts of rhythm and tempo in music.
Curated OER
Sextant Measurements
Middle schoolers create a sextant. Using their sextant, students measure the height of tall objects. Middle schoolers explore how sailors used sextants to identify their location on the ocean. They research how sextants are created.
Curated OER
Local Traffic Survey
Students conduct a traffic survey and interpret their data and use graphs and charts to display their results.
Noyce Foundation
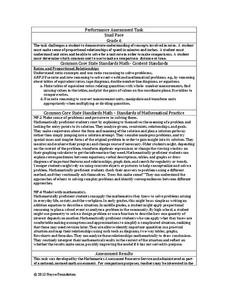
Snail Pace
Slow and steady wins the race? In the assessment task, scholars calculate the rates at which different snails travel in order to find the fastest snail. Hopefully, your class will move much more quickly in finishing the task!
Curated OER
Volume and Surface Area
Students explore volume and surface area. In this math activity, students fill boxes with cubes to identify the volume of the boxes. Students discuss area.
Curated OER
Estimation Task
Upper graders practice their estimation skills by observing different objects then making their best guess without using measuring instruments. Students are asked to estimate mass, length, volume, and area.
Curated OER
Length, Perimeter, and Area
Pupils explore the concepts of length, perimeter, and area. In this math lesson, students use Shape Explorer to practice finding length, perimeter, and area.
Curated OER
How Does Your Tree Measure Up?
Young scholars work in pairs or small groups to gather data about a tree. Each group might gather data about a different tree; all groups might collect data about the same tree; or two teams might gather data about each tree and compare...
Curated OER
Fractions, Decimals and Percents
Students investigate the differences when using decimals, fractions, and percents. They focus on the process of using them in real problems and how to convert them from one form to another.
Curated OER
Area Applet
Elementary math classes calculate the area of a shape and explain the correlation between the size of the perimeter and the areas that can be contained within that perimeter. They also explain the effect the shape of the perimeter has on...
Curated OER
60-30-10
Students use ratios and proportions to represent quantitative relationships as they investigate the concept of how percentages are used by designers. Students decorate the same room using three different percentages of colors.
Curated OER
Caution: Thin ice!
Sixth graders listen to story and respond with comments or questions. They brainstorm unsafe behaviors and randomly fill out templates with different risky behaviors listed on the board. They play RISKO, the Bingo type game.
Curated OER
Biggest Trees in the United States
Young scholars use the Internet (or printed sources) to locate information. They fill in missing information on a graphic organizer (chart) and use the data to answer questions. The research skills help students to develop higher order...
Illustrative Mathematics
Factors and Common Factors
This is an exercise in finding the greatest common factor of two whole numbers. Use in direct instruction or as part of your guided practice. Make up additional problems for home work. It also can be used as a mini-assessment or test...
Curated OER
Numbers and Operations
Students practice using proportions to discover the fraction needed to use the right amount of an ingredient. They calculate the number of ounces in one gallon as well. They answer questions to complete the lesson.


