PBS
Blow the Roof Off!
Blow the minds of young scientists with this collection of inquiry-based investigations. Based on a series of eight videos, these "hands-on, minds-on" science lessons engage young learners in exploring a wide range of topics from making...
Shodor Education Foundation
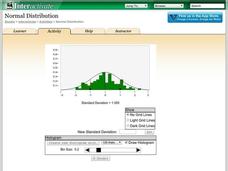
Normal Distribution
Does the size of the bin matter? The resource allows pupils to explore the relationship between the normal curve and histograms. Learners view histograms compared to a normal curve with a set standard deviation. Using the interactive,...
101 Questions
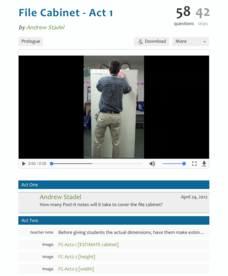
File Cabinet
Take the resource out of the file cabinet. Young mathematicians estimate the number of sticky notes it would take to cover the surface area of a file cabinet. They answer a set of questions on how the number of sticky notes would change...
101 Questions
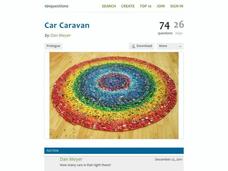
Car Caravan
Keep playing with those old toy cars! Pupils estimate the number of toy cars in an art installation. The only information they receive is a picture showing the toy cars arranged in concentric rings and the diameter of the overall...
EngageNY
Describing Variability Using the Interquartile Range (IQR)
The 13th lesson in a unit of 22 introduces the concept of the interquartile range (IQR). Class members learn to determine the interquartile range, interpret within the context of the data, and finish by finding the IQR using an exclusive...
EngageNY
Describing Distributions Using the Mean and MAD
What city has the most consistent temperatures? Pupils use the mean and mean absolute deviation to describe various data sets including the average temperature in several cities. The 10th lesson in the 22-part series asks learners to...
EngageNY
Creating Division Stories
Create your own adventure story ... well, not really. The fifth instructional activity in a 21-part series has pairs create story contexts for division problems. The instructional activity presents a step-by-step process for pupils to...
EngageNY
Interpreting and Computing Division of a Fraction by a Fraction—More Models
Use a unit approach in developing a fraction division strategy. The teacher leads a discussion on division containing units, resulting in a connection between the units and like denominators. Pupils develop a rule in dividing fractions...
EngageNY
Describing Distributions Using the Mean and MAD II
The 11th lesson in the series of 22 is similar to the preceding lesson, but requires scholars to compare distributions using the mean and mean absolute deviation. Pupils use the information to make a determination on which data set is...
EngageNY
Finding a Rate by Dividing Two Quantities
Develop the right station to solve rate word problems. The 18th lesson in a series of 29 starts by interpreting the aspects of rates with two different quantities. Pupils use the interpretation of rates to solve problems, and groups work...
EngageNY
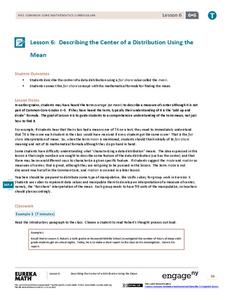
Describing the Center of a Distribution Using the Mean
Everyone does their fair share. The sixth segment in a 22-part unit presents the mean as a fair share. Groups build a conceptual understanding of the mean of a data set, rather than simply learn an algorithm. Learners use the...
EngageNY
Understanding Box Plots
Scholars apply the concepts of box plots and dot plots to summarize and describe data distributions. They use the data displays to compare sets of data and determine numerical summaries.
EngageNY
Creating a Histogram
Display data over a larger interval. The fourth segment in a 22-part unit introduces histograms and plotting data within intervals to the class. Pupils create frequency tables with predefined intervals to build histograms. They describe...
EngageNY
Describing a Distribution Displayed in a Histogram
The shape of the histogram is also relative. Learners calculate relative frequencies from frequency tables and create relative frequency histograms. The scholars compare the histograms made from frequencies to those made from relative...
Space Awareness
How To Travel On Earth Without Getting Lost
Have you ever wanted to travel the world? Take a virtual trip with a geography lesson that uses longitude and latitude, the position of the sun, an astronomy app, and a classroom globe.
West Contra Costa Unified School District
Comparing Data Displays
There is so much more to data than just numbers, and this resource has learners use three methods of comparing data in a multi-faceted lesson. The 21-page packet includes a warm-up, examples, an activity, and assessment for a complete...
California Academy of Science
Greening Your Middle School
Middle schoolers redesign their school to make it more energy efficient, and create a model of their design. Learners get together in groups of 5, and they take on the task of making their school more energy efficient. To do this, they...
Curated OER
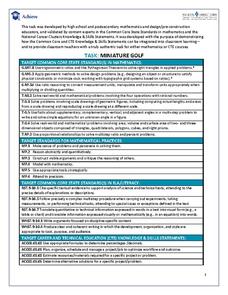
Task: Miniature Golf
"Fore!" All right, no one really yells this out in miniature golf, but this well-defined activity will have your charges using lots of numbers in their unique design of a miniature golf hole. Included in the activity criteria is the...
University of California
Student Workbook: Algebra and Functions
A smorgasbord of functions, this packet has the basics required for your learners to be successful in the land of early algebra. The packet includes solving equations, graphing, evaluating, simplifying and basically everything else in...
Institute of Electrical and Electronics Engineers
Spring Scale Engineering
After examining how a spring scale works, teams work together to design their own general measurement device. Reading material provides background information, but there is no part of the procedure in which learners handle an actual...
Teach Engineering
Efficiency of an Electromechanical System
How efficient is a motor in a LEGO set? Future engineers conduct an activity where a LEGO motor-generator system raises an object to a specified height. They then show what they learned and use their measurements to calculate the energy...
Teach Engineering
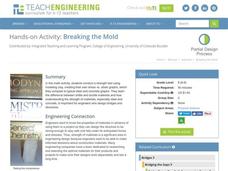
Breaking the Mold
A little too much strain could cause a lot of stress. Groups conduct a strength test on clay. Using books as weights, pupils measure the compression of clay columns and calculate the associated strain and stress. Teams record their data...
Curriculum Corner
Guest Teacher Plans: Grade 6
Taking a day off of school can feel like a lot more work than going because of the time and effort that goes into making sub plans. Make your life easier with a daily plan for a guest teacher designed to meet the needs of sixth graders...
Shodor Education Foundation
Triangle Area
While the lesson focuses on right triangles, this activity offers a great way to practice the area of all triangles through an interactive webpage. The activity begins with the class taking a square paper and cutting in in half; can they...
Other popular searches
- Perimeter Math Measurement
- Math Measurement Inches
- Math Measurement Lesson Plans
- Math Measurement Length
- Math Measurement Metric
- Esl Math Measurement
- Math Measurement Worksheets
- Esol Math Measurement
- Math Measurement Lessons
- Liquid Measurement in Math
- Measurement/math Literature
- Angle Measure Math


