Curated OER
Introduction to Statistics: Mean, Median, and Mode
Students explore the concepts of mean, median, and mode. They develop an understanding and familiarity with these concepts. Students explore mean and median in an efficient way. Students explore three different measures of center.
Curated OER
Fire!, Probability, and Chaos
Upper elementary and middle schoolers work with the concept of probability. They are introduced to the concept of chaos. Learners graph and analyze using a line plot, work with mean, and are introduced to the concept of variance.
Curated OER
Window Treatments for Energy Savings
Students investigate energy-saving window treatments. In this environmental lesson plan, students research how energy-saving windows work by conducting an experiment using a thermometer and graphing data. Students identify why...
Curated OER
Pyrotechnics
Students discuss pyrotechnics and what they have noticed about their height and speed. They think about the path which fireworks follow which is a parabola. They follow multiplication patterns to determine the Zero Product Property and...
Curated OER
Follow That Graph
Young scholars investigate the graphs of six trigonometric functions. They discover how changes in the equation of the basic function affect the graph of the function.
Curated OER
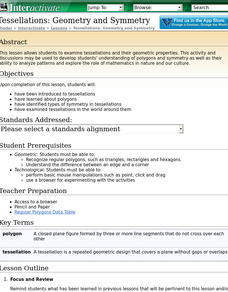
Geometry and Symmetry
Students examine tessellations and their geometric properties. The lesson and discussions may be used to develop students' understanding of polygons and symmetry as well as their ability to analyze patterns.
Curated OER
Speed + Graphing = Winners!
Fifth graders take addition timed tests every day for a two week period. Using the data from the timed tests, they create a bar graph using Microsoft Excel computer software, a personal bar graph using graph paper and colored pencils,...
Curated OER
2.0 "Water Is Life" Global Water Awareness Mini-Unit (Grades3-5)
Students study the amount of potable water on the Earth. In this water lesson plan, students examine the amount of potable water as compared to all the water on the Earth. They discuss why many parts of the world do not have access to...
Curated OER
The Great Pollinators
Students discover the reproductive parts of a plant. In this biology lesson, students identify and categorize several different plants they dissect in class. Students record their information using a data chart.
Curated OER
Michigan Virtual Field Trip
Learners analyze data from a virtual field trip to Michigan. They conduct Internet research on mileage and travel time between cities, calculate and compare fuel costs, and research and calculate lodging, activities, and meal costs.
Curated OER
Using Excel To Teach Probability And Graphing
Students engage in the use of technology to investigate the mathematical concepts of probability and graphing. They use the skills of predicting an outcome to come up with reasonable possibilities. Students also practice using a...
Curated OER
EXCEL It!
Students surf the Web gathering information about graphs. The data collected is incorporated into an Excel spreadsheet and graphs of varying nature generated to further enhance student understanding.
Curated OER
Solving Equations Using Two Operations
Need more detail in showing your class how to solve two-step equations and proportions? This lesson plan outlines the steps young mathematicians need to solve simple equations and check their results.
Curated OER
Student Costs Graph
Young scholars calculate the mileage, gasoline costs, and travel time and costs for a vacation. They conduct a virtual field trip, and create a comparison graph of costs using Microsoft Excel software.
Alabama Learning Exchange
The State Capital of Stem and Leaf
Students explore the concept of stem and leaf plots. In this stem and leaf plots lesson, students plot the 50 US states' capitals on a stem and leaf plot according to the first letter of each state. Students compare their stem and leaf...
Curated OER
Problem Solving Using Power Polygons
Students investigate geometric shapes by creating figures on a plane. In this polygon lesson, students complete a worksheet based on the angles in a power polygon. Students identify the different types of polygons and define their...
Curated OER
Venn Diagram
Students classify items and numbers by using a Venn diagram. In this Venn diagram lesson plan, students use the computer to do this and classify pictures and numbers.
Curated OER
Hurricane Tracking
Students access the Internet to find information on current hurricanes. They get locations, speeds, and air pressures and then plot the location of the hurricane on a hurricane-tracking map. They also access the FEMA website to solve...
Curated OER
Virtual Field Trip: Lodging and Meals
Students calculate the costs for lodging and meals for a virtual field trip. They calculate the number of nights lodging needed for road and city travel and the number of meals needed, the costs for each, and input the data using...
Curated OER
Hybrid Vehicles: Cut Pollution and Save Money
Students examine how driving a hybrid car can save money and cut down on pollution. In this hybrid vehicles lesson students complete an exercise that shows them how to work with proportions, percents, dimensional analysis and linear...
Curated OER
Box Plots
Young scholars review the concept of median, explore how to calculate quartiles for any size data set and experience how to build a box plot.
Curated OER
Get the Picture with Graphs
Fifth graders examine line, bar and circle graphs in the newspaper and on the Internet. They complete sketches of graphs with an emphasis on selecting the best model to depict the data collected.
Curated OER
Charting and Graphing Sales
Students analyze graphs, charts and tables. In this data analysis lesson plan, students practice creating and analyzing charts, graphs and tables corresponding to sales and surveys. This lesson plan uses data relevant to students and...
Curated OER
The Tale of the Feral - Care and Multiplication of Feral Cats
Students differentiate between a feral cat and a domesticated cat. In this cat lesson plan, students use the scientific method, calculate averages, solve story problems, and learn how a caretaker can help a feral colony live safely.


