Curated OER
Graphs
Students list their favorite cars and create graphs of their favorites. Students determine how the graphs would change as their choices change.
Curated OER
The Dog Days of Data
Young scholars are introduced to the organization of data This lesson is designed using stem and leaf plots. After gather data, they create a visual representation of their data through the use of a stem and leaf plot. Students...
Curated OER
Introducing Trig
Fifth graders explore the importance of triangles in the real world. They find the unknown side of a right triangle using a scale drawing. Students use Pythagoras' Theorem and other appropriate ratios.
Curated OER
Mathematics Witing: Algebraic Processes and Its Connections to Geometry
Students, using manipulatives, determine how many different ways there are to arrange 3 and 4 objects. They organize and record their arrangements. Students investigate the pattern generated by 3 and 4 objects, they predict how many ways...
Curated OER
Equivalent Fractions
If you are looking for a simple way to review equivalent fractions, this is a great resource. Using a visual means and a series of examples, learners review this skill. There is a worksheet provided and a prompt to encourage pupils to...
Curated OER
I'm Out of Here
Students create a travel budget. In this budget lesson, students research vacation destinations. Working independently, students research destinations on the Internet and construct a budget for the vacation. Resources provided.
Curated OER
Pumped Up Gas Prices
Students calculate gas prices. In this transportation lesson plan, students tally the mileage and gas costs of their car for one months. They figure out how much was spent on gas and create a graph showing average gas prices over time.
Curated OER
Lego Robotics: Measuring Speed
Students build and program a LEGO robotic car as well as measure and graph its speed. They acquire familiarity with principles of construction, motion, design and problem solving. They compare a robot's speed over two different surfaces...
Curated OER
Measurement and the Illampi Mound Colony
Learners comprehend the basic units of measurement, scale, plotting, and basic grids. Students practice their estimation
and measuring skills and will demonstrate their ability to work well in groups.
Curated OER
What's Your Average? What Do You Mean? I'm More Than Just Average
Upper grade and middle schoolers collect data, analyze and interpret the data. This three-part lesson should provide learners with a firm understanding about the differences between mean, median, and mode and how to perform the...
Curated OER
Probability: the Study of Chance
Students experiment to determine if a game is fair, collect data, interpret data, display data, and state and apply the rule for probability. Students use a simple game for this experiment.
Curated OER
Statistics: Misleading or Accurate?
Students explore the concept of misleading statistics. In this misleading statistics lesson plan, students play a game of tag and graph the number of times each student gets tagged. Students use the graph to determine the fastest...
Curated OER
Tasty Tech Activity With Excel
Students are introduce to basic Excel skills, rank their opinions of menu items from fast food restaurants, add their answers to the spreadsheet, and then create a simple graph of the results.
Curated OER
M&M Caper
Students participate in a game with M&M's to be introduced to percents and ratios. Individually, they estimate and record the number of candies they believe the bag holds and the amount of each colored candy. They open the bag and...
Curated OER
Transformations
Learners draw on graph paper. In this geometry instructional activity, students review types of triangles and quadrilaterals. Learners investigate geometric transformations, including translation, rotation and reflection. Students...
Curated OER
A Matter of Fact
Students design their own Science experiment. In this science experiment lesson students create a hypothesis related to matter and test it. They displayed their data in a graph.
Curated OER
Bell Curve
Students explain normal distribution of a measurable characteristic within a group of objects. They create two graphs (one for each type of Hershey's Kiss) with increments of measurement on the X-axes and number of measurements on the...
Curated OER
Altimetry
Fifth graders accurately measure the distance to eight points on an uneven surface by conducting a simulation of sattelite altimetry. They create a two-dimensional model of the simulated ocean surface by graphing data from the Radar Run...
Curated OER
That was Then, This is Now
Young scholars compare and contrast data charts and statistics for food prices of now and in the past. In this food prices lesson plan, students answer short answer questions and calculate computations.
Curated OER
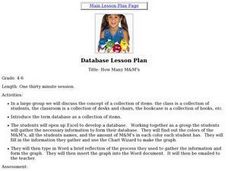
How Many M&M's
Students explore sets and collections. Students find the colors of M&M's and the amount of M&M's each student has. They organize this information into an Excel spreadsheet. Students use the chart wizard to create a graph.
Curated OER
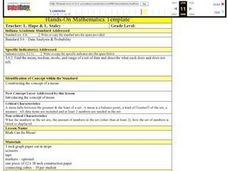
Math Can Be Mean!
Fifth graders are introduced to the topic of means. Calculating the mean, mode and median, they describe what each set of numbers tell and do not tell about the data. They use a line graph to practice finding the mean. They also use...
Curated OER
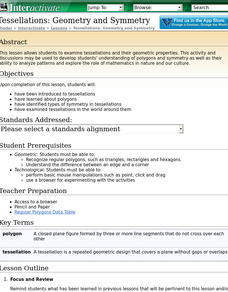
Geometry and Symmetry
Students examine tessellations and their geometric properties. The lesson and discussions may be used to develop students' understanding of polygons and symmetry as well as their ability to analyze patterns.
Curated OER
What Is Your Measure
Students engage in the study of measurement. They practice using different objects that can be found in class or brought from home. Students are introduced to the history of measurement. They compare and contrast the standard and metric...
Curated OER
Sink or Float?
Young scholars predict and explore to discover which objects sink or float in fresh and salt water, predict how salt affect objects, write predictions on T chart, discuss difference between man-made and natural waters, and graph results.


