Curated OER
Math Journal: Functions and Coordinate Geometry
Fifth graders examine the many uses of coordinate grids. In this graphing lesson, 5th graders write data driven equations, discuss the x and y-axis, and determine if using 2 or 3 ordered pairs is better. Students complete several...
Curated OER
I. M. Pei and the Geometry of the NGA
Students compare design elements in neoclassical and modern architecture. They review knowledge of triangles and quadrilaterals and design a geometric pattern using Pei's polygons They create a city plan using a variety of lines and...
Curated OER
Ratios, Proportions and Percents
Fifth graders complete 3 activities centered around percents. In this ratios, proportions and percents lesson, 5th graders create designs on grid paper that illustrate a variety of percents, solve percent problems mentally, and use...
Curated OER
So Fast! So Slow!
Fifth graders give examples of objects that move slow and fast. In this physics lesson, 5th graders rank animals according to how quickly they move. They create a bar graph of organisms versus rates of speed.
Curated OER
How Far Did They Go?
Students create a map. In this direction and distance lesson, students come up with familiar places in the community and calculate the distances from these places to the school. Students create a map that displays these places and their...
Curated OER
Quilting With Students: Using Fractions to Develop Quilt Designs
Students create and study paper "quilt blocks" that represent fractions. In this fraction lesson, students color squares in different dimensions in order to discover the basics of fractions.
Curated OER
Use Google Maps to Teach Math
Capture the engagement of young mathematicians with this upper-elementary math lesson on measuring time and distance. Using Google Maps, students first measure and compare the distance and time it takes to travel between different...
AIMS Education Foundation
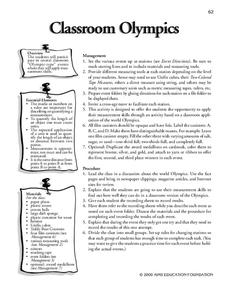
Classroom Olympics
As the Summer Olympics are approaching, incorporate Olympic-type games into the classroom. From straw javelin to cotton ball shot put, these games are sure to keep leaners engaged. The best part is that there is math involved! Pupils...
Curated OER
The Dog Days of Data
Students practice an alternative form of data presentation. They practice sequencing data, identifying the stem-and-leaf, creating stem-and-leaf plots, and drawing inferences from the data by viewing the plots.
Curated OER
Sizing Pumpkins
Fifth graders study the sizes of pumpkins. They measure and record the diameters of pumpkins. They create five subtraction problems and solve them. They weigh their pumpkins, record the data and select two pumpkins to make a graph of...
Curated OER
Childhood Obesity
Students identify a question to generate appropriate data and predict results. They distinguish between a total population and a sample and use a variety of methods to collect and record data. Students create classifications and ranges...
Curated OER
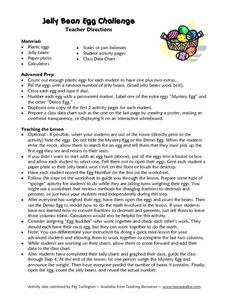
Jelly Bean Egg Challenge
Students each receive a plastic egg filled with jelly beans. In this Jelly Bean Egg Challenge, students estimate and weight their eggs, they count the number of jelly beans inside their egg, they chart their data and compare their data...
Curated OER
Rocketsmania And Slope
Students use a professional basketball team's data and graph it on a coordinate plane. They draw a line of regression and finding its equation. They access a website containing statistics for the Houston Rockets basketball team to solve...
Curated OER
Patterns in Nature
In this patterns in nature learning exercise, students read about the Fibonacci Spiral, then follow the directions to plot one on the graph paper and draw the spiral, with links to more information.
Curated OER
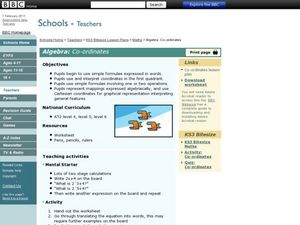
Algebra: Co-ordinates
Learners use Cartesian coordinates. In this graphing lesson students use simple formulae, interpret coordinates, and create graphical representations. They express their work algebraically.
Curated OER
Factors That Affect Climate
Fifth graders use captured portions of the Internet ("mininets") to perform research into climate. They create graphs of the data recorded using latitude as the independent variable and temperature as the dependent variable.
Alabama Learning Exchange
The State Capital of Stem and Leaf
Learners explore the concept of stem and leaf plots. In this stem and leaf plots instructional activity, students plot the 50 US states' capitals on a stem and leaf plot according to the first letter of each state. Learners compare...
Curated OER
Fly Away With Averages
Students study mean, median, and mode. They construct paper airplanes and test them to see how far they fly. They measure the distance and then find the averages of their throws. They use spreadsheet software to record the data in a...
Curated OER
Home on the Biome
Fifth graders study six major biomes, graph temperature and rainfall, and present their findings to the class.
Curated OER
Understanding Cloud Formation
Pupils read and relate the poem, "Clouds" by Aileen Fisher to a demonstration on cloud formation. They create clouds in jars using ice water and matches then discuss the ways clouds can be used to predict weather.
Curated OER
Finding the Salt Front
Students discuss definitions of estuary, salinity, and the salt front. They listen as the teacher explains the Hudson River Miles and ways the upriver and downriver sections relate to the north and south. Students graph the salt front...
Curated OER
The Bigger they Are . . .
Students do a variety of data analyses of real-life basketball statistics from the NBA. They chart and graph rebounding, scoring, shot blocking and steals data which are gathered from the newspaper sports section.
Curated OER
Design Your Space
Learners evaluate the acceptable use of classroom space. The class participated in a brief lecture and discuss of floor plans and how they are used in architecture. Using graph paper, they create a scale drawing of the classroom...
Curated OER
PASS the Arts
Students explore math and art concepts, create digital art examples of the concepts, and incorporate these works into a PowerPoint portfolio with explanation and analysis.


