Curated OER
Usage and Interpretation of Graphs
Students explore graphing. In this graphing instructional activity, students predict how many shoe eyelets are present in the classroom. Students count eyelets and work in groups to organize and chart the data collected. Students put all...
Curated OER
Graphing the Forecast-Line Graph or Bar Graph?
Students explore bar and line graphs. In this data collection, graphing, and weather instructional activity, students compare bar and line graphs and discuss which type of graph would be most appropriate for displaying a ten day weather...
Curated OER
Graphing Using Excel
Fifth graders complete a series of graphs by gathering information and using Excel to graph the information. In this graphing lesson, 5th graders graph favorite desserts of the class. Student put their results into the computer and then...
Curated OER
Graphing Points: Pre Test
In this graphing points worksheet, students complete multiple choice questions about axis's on a graph and points on a graph. Students complete 10 questions total.
Curated OER
Graphing Points: Post Test
In this graphing points learning exercise, students answer multiple choice questions about the points on a given graph. Students answer 10 questions total.
Curated OER
Interpreting Graphs
Students investigate graphs. In this graphing instructional activity, students create a graph regarding the population of California. Students extrapolate answers concerning the data set.
Curated OER
Plot the x-y Coordinates on the Grids Below
In this coordinate grid graphing worksheet, students plot the given points onto each of 6 coordinate grids. All points are located in quadrant 1. One point is plotted on each grid. Answers are given by clicking the appropriate place on...
Curated OER
Graph Made Easy: Post Test
In this graphs instructional activity, students answer multiple choice questions about line graphs and bar graphs. Students answer 10 questions total.
Curated OER
The Coordinate Plane
Fifth graders use the attached worksheet, Where's My Location? - Directions, to play a game in which they plot points on a grid.
Curated OER
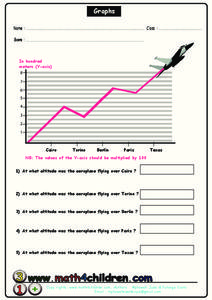
Graphs
In this graph practice instructional activity, students examine a graph and use their problem solving skills on order to respond to 5 questions regarding the information presented on the graph.
Curated OER
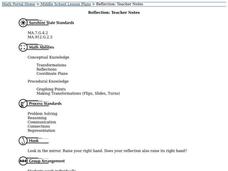
Reflection
Students examine how some transformations, such as reflections and rotations, do not change the figure itself, only its position or orientation.
Curated OER
Coordinate Graphs
Students use coordinate graphs in order to identify objects and their locations. They are shown how to plot the x and y coordinates and then are given values to be plotted during guided and independent practice. Students are assessed on...
Curated OER
Life Expectancy at Birth
Students create a line graph on the life expectancy for males and females in Canada. In this math and health lesson plan, students review table and graph terminology, create line graphs, and analyze the differences in life expectancy...
Curated OER
Match My Masterpiece
Fifth graders plot out points on grid paper which correspond with the ordered pairs they are given. If done correctly, the points form a word.
Curated OER
"If You Hopped Like a Frog" by David M. Schwartz
Pupils search for and generalize an algebraic pattern. They make and analyze a coordinate graph.
Curated OER
An Introduction to Data Reading and Computations
Students discover data reading and computations. In this math lesson plan, students collect nutritional data about intakes of certain foods compared with daily recommended allowances. Students create their own data charts based on their...
Curated OER
Circles Minilab
Students learn how to measure the diameter and circumference of a circle. In this circle lesson, students organize their data to create a graph. Students utilize their graph to make an inference about the slope of pi.
Utah Education Network (UEN)
Integers on a Coordinate Plane
Boogie fever! Explore the concept of integers on coordinate plane. In this integers on a coordinate plane lesson, students graph rational numbers on the coordinate plane and identify coordinates of a point. Students perform a line dance...
Curated OER
Force and Gliders
Students explore physics by creating data graphs in class. In this flight properties lesson, students read the book Flying Machine and identify the force, resistance and construction necessary to keep a glider in the air. Students...
Pennsylvania Department of Education
Classifying Figures on the Coordinate Plane
Fifth graders use estimation to solve word problems. In this fractions lesson, 5th graders decide whether or not an answer to a work problem is reasonable by applying their knowledge of fractions, decimals and estimation. This lesson...
Curated OER
Thiebaud Cake Math: Elementary
Students explore the American artist Wayne Thiebaud. They practice addition, subtraction, fractions, money problems, and classification problems by carefully examining his painting entitled Cakes. They create a bold cake painting.
Curated OER
Plotting Points
In this coordinate pairs learning exercise, students learn to plot points on a graph. Students study the examples and then complete 20 questions. This is intended as an online activity, but may be completed with pencil and paper.
Curated OER
Line and Double Line Graphs: Reteach
In this graphing worksheet, students review the five steps for making a double line graph to display data. Students then use the graph they made following the shapes to answer the three questions.
Curated OER
Locating Rational Numbers on the Number Line
Students explore the concept of locating rational numbers on a number line. In this rational numbers lesson, students change improper fractions to mixed numbers to determine where on a number line the rational number belongs. Students...
Other popular searches
- X and Y Axis
- X Y Axis
- Reflection X Axis
- X and Y Axes
- Dependent Axes
- Axis (Axes
- Axes 0
- Stone Axes
- Graphing X Y Axis
- Independent Axes
- Reflection Across X Axis
- Horizontal and Vertical Axes


