Curated OER
Family Activity: Bar Graphs and Line Graphs
For this math worksheet, students work at home with a family member on a graphing activity. Students count the number of cans, glass jars, boxes and bags in the pantry. Students make a bar and a line graph to represent the data.
Curated OER
Graphing Information from a Data Table
For this graphing worksheet, students solve 12 problems in which data on a table is presented on a bar graph. This page is intended to be an online activity, but may be completed with paper and pencil.
Curated OER
Froot Loops to the Max - 1
Middle schoolers complete and solve five questions related to a box of Froot Loops cereal. First, they determine how many of each color of Froot Loops and which color has the greatest and least frequency. Then, pupils write the fraction...
Curated OER
Froot Loops to the Max - 2
In this Froot Loops to the max worksheet, learners complete and solve 5 problems related to a box of Froot Loops cereal. First, they determine how many of each color is represented in the box of Froot Loops. Then, students determine...
Curated OER
Did You Eat That! - Food Graph
In this health and diet instructional activity, students ask ten of their friends what their favorite vegetables are. Then they tally their votes and shade them in on the graph provided.
Curated OER
Generate Measurement Data Word Problems
Plot data for three word problems, each with a table of data. Learners create line plots for these, all of which have only single-digit whole numbers. The large text and few number of problems make this ideal as a whole-class warm up....
Curated OER
Graphing - Length
In this graphing instructional activity, students create a bar graph showing the approximate maximum length of 12 different types of fish.
Curated OER
Graphs and money
In this graphs and money worksheet, students complete word problems about different kinds of graphs and money in those graphs. Students complete 10 multiple choice problems.
Virginia Department of Education
May I Have Fries with That?
Not all pie graphs are about pies. The class conducts a survey on favorite fast food categories in a lesson plan on data representation. Pupils use the results to create a circle graph.
Curated OER
Introductory Algebra Chapter 3 Review
In this math worksheet, middle schoolers find the solutions to the problems while interpreting the line, bar, and circle graphs. The examples are given to help in the context of each objective.
Curated OER
Let's Graph It! Pre-Test
For this graphing worksheet, students complete a set of 10 multiple choice questions, clicking on a link to see correct answers or print the page.
Curated OER
Using Data to Make Graphs: Pretest
In this data worksheet, 5th graders answer multiple choice questions on data and graphs. Students answer 10 multiple choice questions.
Curated OER
My Test Book: Reading Graphs
In this online interactive math skills worksheet, students solve 10 multiple choice math problems that require them to read and interpret graphs. Students may view the correct answers.
Curated OER
Graphs in the News
In this graphs worksheet, students locate 2 kinds of graphs in the newspaper and answer short answer questions about them. Students complete 3 questions.
Curated OER
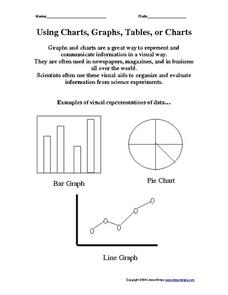
Using Charts, Graphs, Tables, or Charts
In this charts, graphs and tables worksheet, students view 3 different types of visual representations of data, make a list of 20 items and decide how the items can best be put together in groups to make a graph, chart or table. Students...
Math Moves U
Collecting and Working with Data
Add to your collection of math resources with this extensive series of data analysis worksheets. Whether your teaching how to use frequency tables and tally charts to collect and organize data, or introducing young mathematicians to pie...
Noyce Foundation
Granny’s Balloon Trip
Take flight with a fun activity focused on graphing data on a coordinate plane. As learners study the data for Granny's hot-air balloon trip, including the time of day and the distance of the balloon from the ground, they practice...
Curated OER
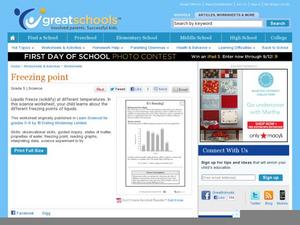
It's Freezing!
Here is a good worksheet for 5th grade scientists. In it, they look at a bar graph that shows the freezing point for a variety of liquids. Then, they are given a scenario of a certain liquid melting and freezing, and must determine which...
Curated OER
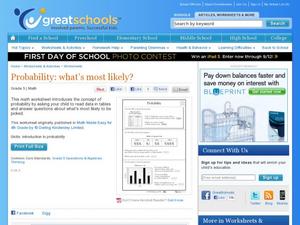
Probability: What's Most Likely?
Work with graphs, tally marks, and probability. Fifth graders read tables with different sets of data, including tally marks and a bar graph, to answer five questions. Use this learning exercise as part of a probability lesson, or as a...
Curated OER
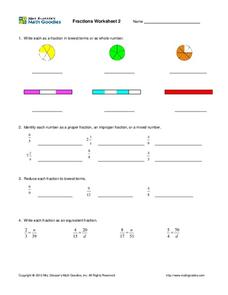
Fractions: pie graphs, numbers, and bars
In this fraction worksheet, students complete fraction problems containing pie graphs, numbers, bars, proper fractions, lowest terms, and more. Students complete 19 problems.
Curated OER
U.S. Beach Attendance
In this bar graphs worksheet, learners analyze the information about beach attendance over a period of 5 years. Students solve 3 story problems about the graph.
Curated OER
Data Analysis Challenge
In this data analysis worksheet, young scholars work with a partner to collect information for a survey. The information is then compiled into a graph. Learners must indicate their survey question, the target audience, predict the...
Curated OER
Graphs
In this graphing worksheet, 6th graders name the place that is at the coordinates given to them of this graph of the city. Students complete 8 problems.
Curated OER
Petro Products
For this petroleum products worksheet, students are given the components of crude oil and they graph the various products found in a 50 gallon barrel. Students complete an activity to determine if they have collected cards that represent...
Other popular searches
- Skittles Bar Graph
- Double Bar Graphs
- Bar Graphs Pictographs
- Histogram and Bar Graph
- Bar Graphs and Histograms
- Bar Graph Problem Solving
- Favorite Food Bar Graph
- Bar Graphs Histograms
- Interpreting Bar Graphs
- Bar Graphs for Birthdays
- Bar Graph Worksheet
- Bar Graphs and Charts


