Curated OER
Organizing And Reading Data
Students complete three parts of an "Organizning and Reading Data" worksheet. First, they go over the rubric to determine the work will be scored. They organize data by taking tallies, make a pictograph and a bar graph using the data....
Curated OER
Graphing Using Cookies
Students differentiate between bar graphs, line graphs, pictographs and bar graphs. After participating in a hands-on cookie activity, students label and draw their own graphs.
Curated OER
Getting A Grip On Graphs
Fourth graders investigate the concept of graphing and comparing different types of data using pictographs, line graphs, scatter plots, etc... They gather data and make interpretations while examining the medium of how it is displayed.
Curated OER
Bar Graph Lesson
Students make a bar graph. In this graphing lesson, students discuss why bar graphs are used and are shown bar graph examples. Students create their own bar graph to compare the heights of different things around the world. Students...
Curated OER
All in the Family
Students use data to make a tally chart and a line plot. They find the maximum, minimum, range, median, and mode of the data. Following the video portion of the lesson, students will visit a Web site to test their data collection skills...
Curated OER
Probability
Here is a classic activity used to introduce your class to the concept of probability and data collection. They will roll one die 30 times, then record and discuss the results. Great introduction, but too shallow to be considered a...
Curated OER
Mystery Graphs
Students study graphs and learn how to display information into a graph. In this graph lesson plan, students construct a graph of their own sorted data, and pick out things in graphs that are inconsistent.
Curated OER
Graphs Galore
Fourth graders conduct surveys to collect data. They analyze and interpret the data, then determine which type of graph is appropriate for the data. Students use the data to make predictions, discover patterns and draw conclusions...
Curated OER
Family Activity: Bar Graphs and Line Graphs
For this math worksheet, students work at home with a family member on a graphing activity. Students count the number of cans, glass jars, boxes and bags in the pantry. Students make a bar and a line graph to represent the data.
Curated OER
Aboriginal Statistics
Fourth graders analyze statistics of Native Americans by creating graphs. In this data analysis lesson, 4th graders define different statistical terms and practice finding those statistics from groups of numerical information about...
Curated OER
Valentine Candy Count
Young scholars analyze a bag of Valentine candy to create a graph. In this graphing lesson, students make predictions, sort by color, record data and make a graph. Young scholars discuss results and make generalizations. Students...
Curated OER
Probability Using M&M's
Students estimate and then count the number of each color of M&M's in their bag. In this mathematics lesson, students find the experimental probability of selecting each color from the bag. Students create pictographs and bar graphs...
Alabama Learning Exchange
Keep It Movin'!
Learners conduct an experiment to study friction. They complete a KWL chart on friction and conduct an activity about the amount of friction on a moving object. To conclude, pupils create a table or graph of the data collected and they...
Curated OER
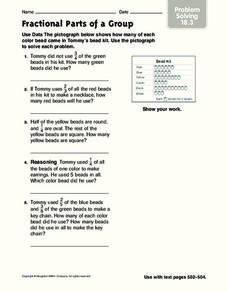
Fractional Parts of a Group
In this problem solving worksheet, students problems solve the answers to 5 mathematical word problems involving fractional parts. Students use data from a pictograph to assist them in solving each word problem.
Curated OER
The Life Cycle of the Mealworm
Fourth graders provide a habitat for live mealworms and observe their life cycle. In this animal life cycle and scientific inquiry lesson, 4th graders create a habitat for a live mealworm and observe and record related data as it grows....
Curated OER
TIMS, The Bouncing Ball: Math, Science, Measurement, Graphs, Variables
Students determine the exact relationship between the height from which a ball is dropped and the distance that it rebounds.
Pennsylvania Department of Education
What is the Chance?
Fourth and fifth graders make predictions using data. In this analyzing data lesson plan, pupils use experimental data, frequency tables, and line plots to look for patterns in the data in order to determine chance. You will need to make...
Cheetah Outreach
Life Cycles
How does a cheetah life cycle differ from a human life cycle? Kids graph weight gain for humans versus cheetahs and compare other life cycle events such as gestation and life span
Curated OER
Using Excel To Teach Probability And Graphing
Students engage in the use of technology to investigate the mathematical concepts of probability and graphing. They use the skills of predicting an outcome to come up with reasonable possibilities. Students also practice using a...
Curated OER
Mathematics and Football
Learners analyze information represented graphically. In this third through fifth grade mathematics lesson, students apply mathematical knowledge to solve real-world problems relating to the Super Bowl. The activities involve number...
Curated OER
Balloon Graphing
Fourth graders explore data, charts and graphs. They create graphs using titles, labels, axes, intervals, and scale correctly. Students enter their data into Excel and create a graph.
Curated OER
Mathematics Witing: Algebraic Processes and Its Connections to Geometry
Students, using manipulatives, determine how many different ways there are to arrange 3 and 4 objects. They organize and record their arrangements. Students investigate the pattern generated by 3 and 4 objects, they predict how many ways...
Curated OER
Marvelous Mathematics
Students make a table on the computer, but create fractions and equivalent fractions through the use of color. They are able to manipulate fractions in order to gain a greater understanding of the meaning of whole number that is broken...
Curated OER
Introduction to Bar Graphs Lesson Plan
Students organize and interpret data using bar graphs.


