Curated OER
Length, Perimeter, and Area
Pupils explore the concepts of length, perimeter, and area. In this math lesson, students use Shape Explorer to practice finding length, perimeter, and area.
Curated OER
All in the Family
Students use data to make a tally chart and a line plot. They find the maximum, minimum, range, median, and mode of the data. Following the video portion of the lesson, students will visit a Web site to test their data collection skills...
Curated OER
No Foot, No Horse
Why do horses wear shoes? Why do people wear shoes? Using worksheets, which are embedded in the plan, learners write descriptive paragraphs about their own shoes, classify a pile of shoes, and also engage in math games about the variety...
Curated OER
Past and Present: Using baseball statistics to teach math
Young scholars use baseball cards to add up batting average and reinforce math skills. In this batting averages lesson plan, students use old baseball cards to practice different math skills and look at other baseball statistics.
Curated OER
Applied Science - Science and Math Post-Lab
Students use scientific tools. In this Applied Science lesson, students investigate the use of scientific tools to enhance observation and discovery. Students indicate how each tool assists scientific work.
Curated OER
Chances Are-Part 1
Students are introduced to the idea of probability by discussing the likelihood of events occurring. Pupils describe events that are certain, impossible, likely, and unlikely to occur. They determine the likelihood of an event occurring...
Curated OER
Assessing and Investigating Population Data
Students examine population projections. In this population data lesson, students research and collect data on the population of the United States. They explore and conclude future population growth patterns. Students construct tables...
Curated OER
M&M Graphing and Probability
Pupils create a variety of graphs. They count, sort, and classify M&M's by color and record data on a chart. They use data from the chart to create pictographs, bar graphs and circle graphs. They analyze data and determine probability.
Curated OER
Math Made Easy
Students evaluate word problems. In this problem solving lesson, students are presented with word problems requiring graphing skills and students work independently to solve.
Curated OER
The Average Kid
Students determine the traits they have in common with other students in the class and create visual profiles of the "average" boy and the "average" girl.
Curated OER
Guess the Card -Probability
This site is used for distance education purposes and professional development of teachers
Curated OER
Probability
Fourth graders predict future outcomes with an investigation of the mathematical principle of probability using spinners constructed by them. The spinner is a hands on application an they combine it with writing a ratio for the...
Curated OER
Data Analysis, Probability, and Discrete Mathematics
Fourth graders analyze the data in a bar graph, pictograph, line graph, and a chart/table and draw conclusions based on the data. They discuss each type of graph, write questions for each graph, and analyze the data as a class.
Curated OER
Math Averages
Students perform different activities to better explain that the word "Average" has 5 different meanings.
Curated OER
Mean, Median, Mode, etc.
Explore the concept of mean, median, and mode with pupils. They estimate the length of a string or the number of M&M's in a jar. Then find the mean, median, and mode of the class' estimates.
Institute of Electrical and Electronics Engineers
Spring Scale Engineering
After examining how a spring scale works, teams work together to design their own general measurement device. Reading material provides background information, but there is no part of the procedure in which learners handle an actual...
Education World
High, Low, or In Between?
Trios play a card game that reinforces the concepts of number sequence and greater than and less than. Scholars make predictions based on information they know and a single unknown. They see cards drawn by others in the group, but not...
Curated OER
Fast Facts
Ever use the inner circle/outer circle method of learning? Placing learners in a stationary inner circle and a rotating outer circle, they roll a die and attempt to be the first to call out an addition or multiplication equation with the...
Curated OER
Hershey Chocolate Fractions
In order for students to acquire knowledge about math concepts, and in particular fractions, they need concrete ways to practice an abstract concept.¿¿¿ Using Hershey bars builds on prior knowledge as most students have probably...
Curated OER
How Do You Measure Up?
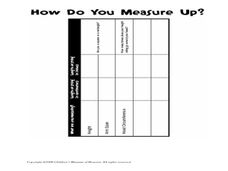
Students measure their body. In this measurement lesson plan, students use a string to measure their height and the circumference of their head. They record this information on the worksheet provided and answer questions as a group.
Curated OER
Children's Museum of Houston - Pre/Post Classroom Activities - Nets
Students make three dimensional shapes with nets. In this nets lesson, students receive nets which they fold to make a three dimensional object. They predict what shape each net will make and verify it after making the net. They use the...
Curated OER
"M&M's"® Candies Worksheet 2
In this math worksheet, learners plot the mean, median, and mode for the colors of M and M candies by filling in the graphic organizer.
Curated OER
Graphing With Paper and Computers
Fourth graders construct bar graphs. In this graphing lesson, 4th graders create bar graphs in connection with the story, The Copycat Fish. After creating the initial graphs on paper, students use MS Excel to create graphs.
Curated OER
Probability of a Boy
Students investigate the concept of even change by participating in a coin flip activity. They research using the Internet to investigate the chance of giving birth to a boy.
Other popular searches
- Probablity Math Lessons
- Probability Math Lessons
- Math Lessons Probabilities
- Math Lessons/ Probability
- Math Lessons on Probability


