Curated OER
Chairs Around the Table
Youngsters become flexible problem solvers with this challenging instructional activity. If there are 24 square tables in a restaurant, how many customers can be seated at one time? They can use manipulatives or draw pictures to help...
Curated OER
Mobile vs. Money
Students research the internet and use the information they find to plot straight line graphs. They use graphs to make comparisons of the various packages offered. Students interpret graphs and solve problems based on varying parameters.
Curated OER
Maximize It!
Students design a rectangular box without a lid that has the largest possible volume using the supplied sheet of centimeter graph paper. They work in groups to construct different size boxes to determine the largest possible volume and...
Curated OER
Gummy vs. Gum
Students explore numbers patterns and write equations to describe the pattern. They apply the equations to further the patterns.
Curated OER
How Alike Are We?
Fourth graders find the range, mode, median, and mean for each of the data sets (height and shoe size). They discuss which measure of central tendency for each data set best represents the class and why. Students graph the shoe size and...
Curated OER
Quadratics: vertex form
Students practice graphing quadratic equations to find the vertex of quadratic functions. They determine if the graph opens upward or downward as well as convert quadratic equations to vertex form from polynomial form. A lab version is...
Curated OER
How Much Will I Spend On Gas?
Students construct a linear graph. In this graphing lesson plan, students determine a monthly budget for gasoline. Students construct a t-chart and coordinate graph to display data. Resources are provided.
Curated OER
Confusing Colors!
Fourth graders collect data, graph their data, and then make predictions based upon their findings. They's interest is maintained by the interesting way the data is collected. The data collection experiment is from the psychology work of...
Curated OER
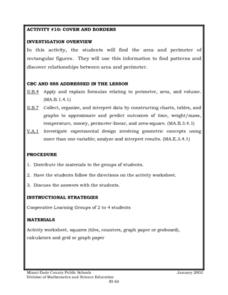
Cover and Boarders
Young scholars find the area and perimeter of rectangular figures. They use this information to find patterns and discover relationships between area and perimeter. Students apply and explain formulas relating to perimeter, area, and...
Other popular searches
- Graphing Linear Equations
- Graphing Lines
- Graphing Linear Systems
- Graphing a Linear Equation
- Algebra Graphing Lines
- Graphing Lines Quilt Pattern
- Graphing Nonlinear Equations
- Pre Algebra Graphing Lines
- Graphing. Linear Equation
- Area Graphing Lines
- Ged Graphing Lines


