Curated OER
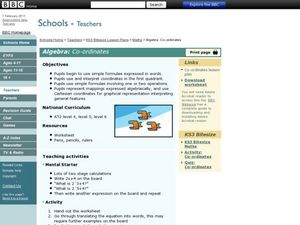
Algebra: Co-ordinates
Students use Cartesian coordinates. In this graphing instructional activity students use simple formulae, interpret coordinates, and create graphical representations. They express their work algebraically.
Curated OER
Graphs Galore
Fourth graders conduct surveys to collect data. They analyze and interpret the data, then determine which type of graph is appropriate for the data. Students use the data to make predictions, discover patterns and draw conclusions...
Curated OER
The Home Stretch
Students read the novel Stone Fox by John Reynold Gardiner. Using Lego RCX units, students build and program sleds to re-enact the "home stretch" of the National Dog Sled Race.
Curated OER
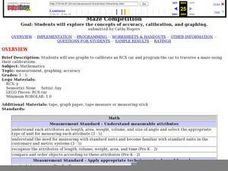
Car Maze competition
Learners use graphs to calibrate an RCX car. They must then program the car to traverse a maze using their calibrations
Curated OER
Mystery Graphs
Young scholars study graphs and learn how to display information into a graph. In this graph lesson plan, students construct a graph of their own sorted data, and pick out things in graphs that are inconsistent.
Curated OER
Misleading Graphs
Students explore number relationships by participating in a data collection activity. In this statistics lesson, students participate in a role-play activitiy in which they own a scrap material storefront that must replenish its stock....
Curated OER
Playing With Probability
Learners rotate through work stations where they compute problems of theoretical and experimental probability. In this probability lesson plan, students use simulations of a lottery system.
Curated OER
Tally Charts and Graphs
Fourth graders play the game 'Data Picking', where they collect data, place the data into a tally chart, and choose the circle graph that best represents the data. They go to the Mathfrog website and select 'Picking'. Students choose...
Pennsylvania Department of Education
The Multiplicative Identity and Numbers Close to One
Pupils practice multiplying and dividing whole numbers by fractions. They study the multiplicative identity property that states that the product of any number and 1 is that number. They multiply whole numbers by fractions close to 1 and...
Curated OER
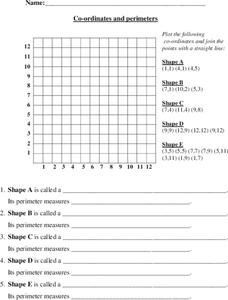
Coordinates and Perimeters
Here is a lesson containing a great activity based on coordinates, and the perimeters of shapes created using a given set of coordinates. After youngsters creat a shape on a grid based on some coordinate pairs, they must identify which...
Curated OER
Graphing Lesson Plans
By using hands-on graphing lesson plans students can learn how to collect data, and display the information using graphs.
Curated OER
Ratios
Fourth graders complete a taste test of different sandwiches, rate them, and then put them in a ratio graph. In this ratio lesson plan, 4th graders write what they learned about ratios after this activity.
Curated OER
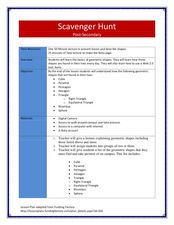
Scavenger Hunt
Students collect data about lighting conditions around a room using a light sensor and RCX. They use software to upload and analyze the data in order to draw conclusions about light intensity in the room.
Curated OER
Graphs Abound
Students create a survey for their classmates to collect data on their favorite foods, eye color, pets or other categorical data. They compile the data from the survey in a table and then make a bar graph of each category using a web tool.
Curated OER
Calculating Total From Percents
Using this short review of finding a percentage of a number, learners can practice important skills. There are twelve questions on this worksheet.
Curated OER
Raisin Cane
Young scholars estimate and record the number of raisins in a snack-size box. They also graph their results and note the differences (+ or -) from their estimate and actual number.
Curated OER
"M&Ms"® Candies Worksheet 1
In this math worksheet, students find the likelihood of different outcomes with the use of M and M's candy for the seven questions and fill in the graphic organizer.
Curated OER
Survey and Share
Young scholars practice collecting data by surveying other students. In this data collection lesson plan, young scholars decide on a question and collects data from 15 other students. Eventually the young scholars will end up graphing...
Alabama Learning Exchange
Scaling Down the Solar System
Learners work collaboratively to gain a better understanding of the vastness of space by scaling down the solar system. They measure by inches, gain an understanding of space, and model the distances of the planets from the sun.
Curated OER
How Much Will I Spend On Gas?
Students construct a linear graph. In this graphing lesson, students determine a monthly budget for gasoline. Students construct a t-chart and coordinate graph to display data. Resources are provided.
Curated OER
Fly on the Ceiling
Fourth graders play variety of games to help them explain coordinates.
Curated OER
Follow That Ship!
Learners in this exercise are introduced to the distinct ways of measuring distance (nautical miles) and speed (knots) at sea, as well as the concepts of latitude and longitude for establishing location.
Curated OER
Immigration Graphs
Fourth graders study immigration. In this graphing lesson, 4th graders make a population graph of people who have immigrated to Indiana.
Curated OER
The Bigger they Are . . .
Young scholars do a variety of data analyses of real-life basketball statistics from the NBA. They chart and graph rebounding, scoring, shot blocking and steals data which are gathered from the newspaper sports section.
Other popular searches
- Frequency Tables Line Plots
- Line Plots Grade 3
- Math Line Plots
- Christmas Line Plots
- Line Plots and Tallies
- Activities Using Line Plots
- Data Analysis Line Plots
- Human Line Plots
- Ell Math Line Plots
- Line Plots With Airplanes
- Charts, Tables, Line Plots
- Charts Tables Line Plots


