Curated OER
The Number Line
Learners graph and order numbers using a number line. They also solve word problems using fractions and decimals and rewrite equations to solve problems correctly. Several example word problems are given.
Florida Center for Instructional Technology
A Human Number Line: Teacher Notes
Twenty-one pieces of tagboard can lead your class to a greater understanding of integers when you use them to form a human number line. After creating this math tool, two strategies for adding and subtracting will have your...
Curated OER
Graphing Equations
In this graphing equations on a grid instructional activity, students solve 10 problems. Students find the value of y for the value of x in the equations. Students make a table of ordered pairs and graph them on a grid.
Curated OER
Misleading Graphs
Students explore number relationships by participating in a data collection activity. In this statistics lesson, students participate in a role-play activitiy in which they own a scrap material storefront that must replenish its stock....
Curated OER
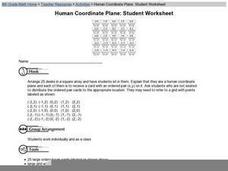
Human Coordinate Plane: Student Worksheet
An excellent way to teach the basics of coordinate graphing is here for you! Young mathematicians take on the identity of one of the two numbers in a coordinate pair, and the entire class must arrange themselves in the proper order. This...
Pennsylvania Department of Education
Use Order of Operations to Evaluate Expressions—No Grouping Symbols
Students identify and explain different types of data collection and graphs. For this graphs and data collection lesson, students record their observations of a variety of data collection tools and graphs displayed in the room. Students...
Curated OER
Mobile vs. Money
Students research the internet and use the information they find to plot straight line graphs. They use graphs to make comparisons of the various packages offered. Students interpret graphs and solve problems based on varying parameters.
Curated OER
Balanced Or Unbalanced
Students use physical models and graphs in order to solve problems that have their origin in the real world that require algebraic thinking. The words are changed into equations and inequalities in order to be solved. This requires...
Curated OER
Gummy vs. Gum
Students explore numbers patterns and write equations to describe the pattern. They apply the equations to further the patterns.
Curated OER
Mean, Median, Mode, and Range: Practice
In this line plots instructional activity, students make a line plot for each set of data and identify any clusters or gaps. Students then find the mean, median, mode, and range for the first four problems. Students then find n using the...
Alabama Learning Exchange
Scaling Down the Solar System
Learners work collaboratively to gain a better understanding of the vastness of space by scaling down the solar system. They measure by inches, gain an understanding of space, and model the distances of the planets from the sun.
Los Angeles County Office of Education
Assessment For The California Mathematics Standards Grade 4
Have scholars show what they know with a 20-page assessment aligned to the California State Standards. The test covers concepts such as large and whole numbers, all four mathematical operations, fractions, decimals, geometric figures,...
Curated OER
Mapping the Ocean Floor
Students construct and interpret a line graph of ocean floor depth and a bar graph comparing the height/depth of several well-known natural and man-made objects and places. In addition, they calculate the depth of two points using sonar...
Curated OER
How Much Will I Spend On Gas?
Students construct a linear graph. In this graphing lesson plan, students determine a monthly budget for gasoline. Students construct a t-chart and coordinate graph to display data. Resources are provided.
Curated OER
Algebra: Co-ordinates
Students use Cartesian coordinates. In this graphing lesson students use simple formulae, interpret coordinates, and create graphical representations. They express their work algebraically.
Curated OER
Confusing Colors!
Fourth graders collect data, graph their data, and then make predictions based upon their findings. They's interest is maintained by the interesting way the data is collected. The data collection experiment is from the psychology work of...
Noyce Foundation
Time to Get Clean
It's assessment time! Determine your young mathematicians' understanding of elapsed time with this brief, five-question quiz.
Curated OER
Olympic records through time
Young scholars compare the records of gold medal Olympic winners for the last 100 years and decide if we are faster, stronger than in the past.
Curated OER
Chronic Conics
Fourth graders use two activities to draw four different conic sections. One activity is of a physical nature and one is traditional paper and pencil.
Curated OER
Playing With the Grid
Students examine works of grid art by the painter Chuck Close. They discuss the process of creating a drawing using a grid, view images of grid art, and create a grid drawing.


