Curated OER
Sharing Brownies: Fractions That Represent a Fair Share
Elementary graders discover the concept of fractional pieces of a whole. They investigate the meanings of fractions in everyday life and why they are used. Pupils divide brownies amongst each other to demonstrate the use of fractions...
Curated OER
The Pythagorean Puzzle
An engaging hands-on activity is presented. Learners of all ages are addressed in thie unique plan. K-5 learners identify, name, and define a rectangle, square, triangle, and the concept of area. Older learners prove the Pythagorean...
Curated OER
Winter Olympics History Year by Year
Investigate the history of the Winter Olympic Games. After researching this event and compiling necessary statistics, pupils use a graphic organizer to chart their findings. A template for a chart is included in this resource. Have your...
Beacon Learning Center
Line Plots
Introduce line plots, show examples of tables, graphing on a number line, and engage in a class discussion. Share the process by which statistical data is organized and displayed on a number line. Examples and worksheets are included....
Curated OER
Cartography Project
A lesson involving mapping, the use of a compass, writing and following directions, and exploring the first two themes of geography is here for you. Learners create original maps that show the routes they take through their own...
Curated OER
Clowning Around: Drawing
Kids create a clown out of shapes. They work to show emotions while practicing their drawing skills. Pupils use circles, triangles, squares, oil pastels, and their imagination to draw, color, and decorate a sad or happy clown. Tip: Have...
Ohio Department of Education
Describing and Creating Plane Figures - Grade One
Young mathematicians draw, create, and describe different shapes using triangles. They discuss attributes of the original and created shapes. Pupils classify the created shapes and draw and write in mathematics journals to communicate...
Curated OER
Dollars and Sense
Fourth graders read "Starting a Business" and answer the question: "How could you design an ad to let the community know about the business described in the story?" Then, they illustrate a written ad that could be posted in the...
Curated OER
How To Measure Area
Geometers learn how to measure the area in square units. They use the floor in the classroom as a visual to measure a square foot area. They use classmates to fill the space and expand the measured area square foot by square foot until...
Curated OER
Mean, Median, Mode, etc.
Explore the concept of mean, median, and mode with pupils. They estimate the length of a string or the number of M&M's in a jar. Then find the mean, median, and mode of the class' estimates.
Curated OER
Water Fun
Students examine uses for water. In this water lesson, students discuss how they use water. As a class students make a PowerPoint by naming one swimming safety rule. Students compare and contrast fishing for fun and fishing for survival.
Curated OER
"Who am I?"
Pupils of all ages work in pairs to find information about themselves and record a digital "Who am I?" They observe and measure each other, write clues, and illustrate before having others guess who is described.
Curated OER
Place Value Made Simple
Elementary schoolers explore place value to the millions place. They construct and evaluate the value of numbers. Working in small groups, pupils problem solve with pocket place value charts, and examine standard and expanded forms. This...
Curated OER
Multiplication Magic
Investigate multiplication problem solving strategies by working with base 10 blocks. Learners decompose problems with a Merlin the Magician theme. Multiple resources are provided.
Curated OER
Defining Division
Upper graders explore division through fair-shares. They will review fair shares and fractions as a segway into division. They start by playing "Share Fairly" game and create mathematical arguments for solving problems. Manipulatives and...
Curated OER
Pedometer Activities to Enhance Cross-curricular Learning
Young scholars complete different activities involving pedometers such as writing a creative story, calculating step averages, researching pedometers, calculating calories, and much more.
Curated OER
Time for Prime
Explore prime numbers. Learners use an interactive 100's chart to identify prime numbers, discuss a glossary of terms, use cards to list multiples of 2,3,4,5, and play a bingo game.
Shodor Education Foundation
Sets and the Venn Diagram (Beginner)
Venn diagrams are helpful in understanding the idea of a set and using attributes to sort items. This basic plan is an introduction with an added bonus of an applet that can be used to demonstrate the activity. If a classroom of...
MENSA Education & Research Foundation
Fabulous Fibonacci and His Nifty Numbers
Fibonacci numbers are not only found in the classroom but also in nature. Explore the concept of Fibonacci numbers through a series of lessons designed to gain insight into the mathematical reasoning behind the number pattern, and spark...
Curated OER
Rounding Decimals
Fourth graders engage in a lesson that is about the concept of rounding decimals. They review place value and focus it upon the practice of rounding. Students use 10 base decimal grids or models to help make connections with the skill.
Curated OER
Counting with Base - Ten Models
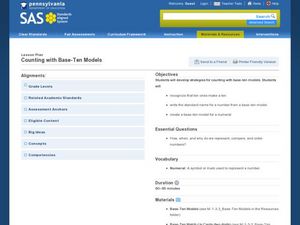
Help your kids develop strategies for counting. In this base-ten lesson, learners use matching cards, base 10 blocks, and dry erase markers and boards to examine the base 10 counting system.
Pennsylvania Department of Education
Volume and Surface Area
Build boxes using unit cubes to compare surface area and volume. The group performs multiple experiments to determine properties of volume, such as if it makes a difference which order the dimensions are multiplied in. Extensive...
Pennsylvania Department of Education
Build What I've Created
n this geometric lesson, students define and identify two dimensional shapes based on their attributes. They complete worksheets based on the geometric concepts.
Pennsylvania Department of Education
What is the Chance?
Fourth and fifth graders make predictions using data. In this analyzing data instructional activity, pupils use experimental data, frequency tables, and line plots to look for patterns in the data in order to determine chance. You will...
Other popular searches
- Math Assessment on Coins
- Elementary Math Assessments
- Math Assessment Test
- Math Assessment Fractions
- Cumulative Math Assessment
- Fitness Assessment Math
- Baseline Math Assessment
- Third Grade Math Assessment
- First Grade Math Assessment
- Grade 4 Math Assessment
- Math Assessment Questions
- Basic Math Assessment
