Curated OER
Graphing Ordered Pairs
Here is graphing activity which has pupils graph ordered pairs and label the axis. They graph five ordered pairs and then interpret the data in the graph.
Curated OER
Bar Graph- Calories In Fast Food Items
In this bar graph worksheet, students analyze a bar graph that shows calories in 10 fast food menu items. Students answer 7 questions about the graph.
Curated OER
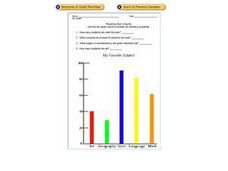
Reading Bar Graphs: My Favorite Subject
In this bar graphs worksheet, students analyze a bar graph about favorite school subjects. Students use the information on the graph to answer 7 questions.
Curated OER
Blank Bar Graph -interval of 5
In this blank bar graph activity, students use the grid to display data in a bar graph. The intervals labeled are counting by 5s, from 5 to 50.
Curated OER
Data Handling: Pictogram of Birds
In this pictograph problem solving worksheet, students analyze a pictograph of birds seen each day for a week. They use the information on the graph to solve 6 problems.
Alabama Learning Exchange
Keep It Movin'!
Learners conduct an experiment to study friction. They complete a KWL chart on friction and conduct an activity about the amount of friction on a moving object. To conclude, pupils create a table or graph of the data collected and they...
Beacon Learning Center
Line Plots
Introduce line plots, show examples of tables, graphing on a number line, and engage in a class discussion. Share the process by which statistical data is organized and displayed on a number line. Examples and worksheets are included....
Curated OER
Rescue Mission Game
Students conduct probability experiments. For this rescue mission lesson, sudents play a game and collect statistical data. They organize and interpret the data and determine the probability of success. Students plot points on a...
Curated OER
Flicking Football Fun
Young mathematicians fold and flick their way to a deeper understanding of statistics with a fun, hands-on math unit. Over the course of four lessons, students use paper footballs to generate data as they learn how to create line...
Pennsylvania Department of Education
What is the Chance?
Fourth and fifth graders make predictions using data. In this analyzing data lesson, pupils use experimental data, frequency tables, and line plots to look for patterns in the data in order to determine chance. You will need to make a...
Utah Education Network (UEN)
The Human Line Plot
Learners collect data and use charts and line plots to graph the data. Some excellent worksheets and activities are embedded in this fine lesson on line plots.
Curated OER
It Has Been Rubbish For Years
Young scholars are presented with the problems of percentages and focus upon numbers in contrast to 100. They calculate problems with money and are engaged with the use of games as a teaching tool. Students also interpret data as...
Curated OER
Charting and Graphing Sales
Students analyze graphs, charts and tables. In this data analysis lesson plan, students practice creating and analyzing charts, graphs and tables corresponding to sales and surveys. This lesson plan uses data relevant to students and...
Curated OER
Range and Mode Reteach 4.5
In this range and mode learning exercise, students analyze the data table and graph that show numbers of books read. Students use the data to answer 4 questions.
Curated OER
M&M Graphing
Fourth graders name colors of M&Ms and record answers. They estimate number of M&Ms of each color found in a typical package of M&Ms on piece of paper.They record information on sheet of paper and create a spreadsheet. paper.
Curated OER
Survey Says...
Young learners create and implement a school-wide survey about student body favorites! Learners record and analyze the data on a bar graph, picture graph, and line graph, and then display the data. Then, wrap it all up with a celebration...
Curated OER
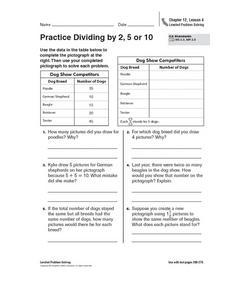
Practice Dividing by 2, 5, or 10
In this pictograph problem solving learning exercise, students analyze the data on a table and create a pictograph. Students read and solve 6 story problems about the pictograph.
Curated OER
Misleading Graphs
Students explore number relationships by participating in a data collection activity. In this statistics lesson, students participate in a role-play activitiy in which they own a scrap material storefront that must replenish its stock....
Curated OER
Organizing And Reading Data
Students complete three parts of an "Organizning and Reading Data" worksheet. First, they go over the rubric to determine the work will be scored. They organize data by taking tallies, make a pictograph and a bar graph using the data....
Curated OER
Getting A Grip On Graphs
Fourth graders investigate the concept of graphing and comparing different types of data using pictographs, line graphs, scatter plots, etc... They gather data and make interpretations while examining the medium of how it is displayed.
Curated OER
Getting A Grip On Graphs
Fourth graders gather variety of data and create a graphs to display the data.
Curated OER
RCX Car Line Graph
Students develop a line graph based on distances that an RCX car drives in specified amounts of time. They then are given a specific amount of time for the car to drive and be asked to extrapolate the car's distance from the graph.
Curated OER
All in the Family
Students use data to make a tally chart and a line plot. They find the maximum, minimum, range, median, and mode of the data. Following the video portion of the lesson, students will visit a Web site to test their data collection skills...
Curated OER
Digger and the Gang
Help online friends Digger and Sprat from the BBC series to solve math problems! In a series of activities, your class will use data sets to calculate measurements, averages, means, and probabilities. The class completes worksheets and...


