Curated OER
Interpreting Data from Birdfeeders
What kinds of birds live in your area? Read a book about birds to your learners and explore their feeding patterns. Charts and graphs are provided in this three page packet, but consider assigning the basic questions if using with young...
Curated OER
Data Handling: Bar Chart Showing Frequency
In this bar graph worksheet, learners analyze a bar graph showing soccer goals scored. Students then use the data to solve 7 problems.
Pennsylvania Department of Education
What is the Chance?
Fourth and fifth graders make predictions using data. In this analyzing data lesson, pupils use experimental data, frequency tables, and line plots to look for patterns in the data in order to determine chance. You will need to make a...
Beacon Learning Center
Line Plots
Introduce line plots, show examples of tables, graphing on a number line, and engage in a class discussion. Share the process by which statistical data is organized and displayed on a number line. Examples and worksheets are included....
Curated OER
Reading Bar Charts
Help kids understand how to collect data through surveys, organize data in a bar chart, then analyze their findings. There are three different surveys for learners to conduct, a full description of all the parts of a bar chart, and three...
Curated OER
Rescue Mission Game
Students conduct probability experiments. In this rescue mission lesson plan, sudents play a game and collect statistical data. They organize and interpret the data and determine the probability of success. Students plot points on a...
Curated OER
Data Handling: Bus Charts
In this data display and analysis worksheet, students study a bar graph that shows the number of people who ride the bus at different times of day. Students use the graph to solve 6 problems. Note: Bus times are shown in 24 hour clock time.
National Security Agency
Line Graphs: Gone Graphing
Practice graphing and interpreting data on line graphs with 36 pages of math activities. With rationale, worksheets, and assessment suggestions, the resource is a great addition to any graphing unit.
Curated OER
Tables & Data
In this problem solving worksheet, 4th graders study the data found on a table involving the number of cans collected during a fund-raiser. Students utilize the concepts of addition and subtraction to solve 8 sentence word problems.
Curated OER
Tables & Data
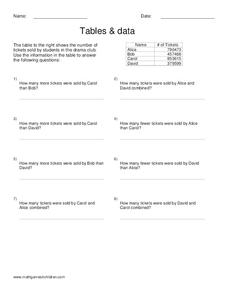
In this problem solving worksheet, 4th graders analyze a table involving how many tickets were sold by 4 students. Students utilize the concepts of addition and subtraction to solve 8 sentence word problems.
Curated OER
Reading Bar Graphs #2
Raise the bar in your third grade class with this learning exercise on bar graphs. Youngsters view three graphs representing three different sets of data, and answer questions based on what they analyze. The first set is completed as an...
Curated OER
Bar Graphs
What are these bar graphs depicting? Novice data analyzers examine two basic bar graphs and answer three comprehension questions about each. The first graph shows tickets sold per date and the next is distances run per member of a cross...
Curated OER
Reading Timetable
Word problems, telling time, and reading charts all come together on this page. After reviewing a table of different travel times for a bus, a tram, a taxi, and a trolley, third graders solve word problems about arrival times and stop...
Curated OER
Tables and Data
In this tables and data worksheet, 4th graders complete word problems based on the tables and data of students recycling cans. Students complete 8 problems total.
Curated OER
Tables & Data
In this tables and data learning exercise, 4th graders complete word problems based on a table of leaves collected. Students complete 8 problems.
Curated OER
Tables & Data
For this subtraction worksheet, 4th graders problem solve 8 sentence subtraction word problems involving different types of birds. Students write their answers on the lines provided.
Curated OER
Practice Dividing by 2, 5, or 10
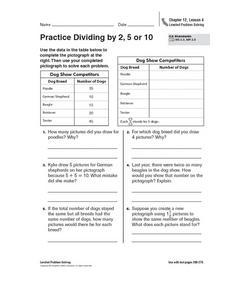
In this pictograph problem solving activity, students analyze the data on a table and create a pictograph. Students read and solve 6 story problems about the pictograph.
Florida Center for Instructional Technology
Integrating Mathematics into Literature
You class will read Cucumber Soup by Vickie Leigh Krudwig as an anticipatory set for this lesson plan on ratios. They make models of the insects in the story and then use them as a source of data for this ratio and proportion lesson...
Curated OER
Creating Graphs from Tables
Students interpret data from tables and then create a graph to show the same data in a different organization.
Curated OER
Skating Data
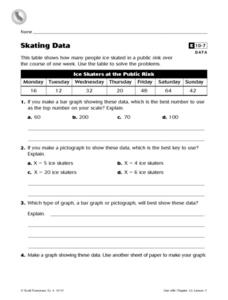
In this collecting data worksheet, 4th graders view a table on ice skaters at a public rink in order to answer 2 multiple choice questions, 1 short answer question and make a graph showing one piece of the data.
Curated OER
Organizing Data Using Tables and Graphs
Students create graphs and tables, as well as interpret and make inferences from the data shown to determine when and where graphs and tables are most useful.
Curated OER
Organizing And Reading Data
Students complete three parts of an "Organizning and Reading Data" worksheet. First, they go over the rubric to determine the work will be scored. They organize data by taking tallies, make a pictograph and a bar graph using the data....
Curated OER
Dealing With Data
Students collect, organize, and display data using a bar graph, line graph, pie graph, or picture graph. They write a summary describing the data represented and compare the graph to another graph in the class.
Curated OER
Making a Bar Graph
In this bar graph worksheet, students analyze a data table and bar graph depicting information about stickers collected. Students answer 5 questions about the data displayed.
Other popular searches
- Creating Data Tables
- Science Data Tables
- Making Data Tables
- Organizing Data in Tables
- Data Tables and Graphing
- Graphs and Data Tables
- Data Tables and Charts
- Create Data Tables From Graphs
- Data Tables Lesson Plans
- Data Tables Surveys
- Pocket Data Tables
- Using Data Displays


