Curated OER
Tasty Tech Activity With Excel
Students are introduce to basic Excel skills, rank their opinions of menu items from fast food restaurants, add their answers to the spreadsheet, and then create a simple graph of the results.
Curated OER
Growing Up With A Mission
Student measure heights and graph them using growth charts for which they find the mean, mode, and median of the data set. They graph points on a Cartesian coordinate system.
Curated OER
Let's Graph It! Pre-Test
For this graphing worksheet, students complete a set of 10 multiple choice questions, clicking on a link to see correct answers or print the page.
National Security Agency
Are You Ready to Call the Guinness Book of Records?
Learners design questions that can be answered by collecting data. In this line-plot activity, pupils collect data and graph on a line plot on world records. An abundant supply of teacher support is provided in this resource.
Curated OER
RCX Car Line Graph
Students develop a line graph based on distances that an RCX car drives in specified amounts of time. They then are given a specific amount of time for the car to drive and be asked to extrapolate the car's distance from the graph.
Curated OER
Use a Bar Graph
In this bar graph worksheet, learners use a given bar graph to answer a set of 3 questions. Answers included on page 2.A reference web site is given for additional activities.
Curated OER
And You Thought Gasoline Was Expensive!
Students carry out a cost analysis. In this comparative math lesson, students compare the cost of equal measures of gasoline to mouthwash, house paint, fruit juice, white-out, and other liquids.
Curated OER
Blast the Fats
Students examine the fats found in foods. In this nutrition lesson plan, students identify the types and amounts of fats found in foods as they research food labels and the Internet. Students classify the fats and record their data.
Curated OER
What Would Make Our School More "Green"?
Students survey their school to get ideas for how to make the school more environmentally friendly. In this environmental lesson, students collect data from other students and teachers. They use the data to create graphs and present a...
Curated OER
Confusing Colors!
Fourth graders collect data, graph their data, and then make predictions based upon their findings. They's interest is maintained by the interesting way the data is collected. The data collection experiment is from the psychology work of...
Houghton Mifflin Harcourt
Unit 5 Math Vocabulary Cards (Grade 4)
A set of 49 cards can enhance fourth graders' math vocabulary. It provides a pair of cards on each sheet, one with the word printed in bold text, and the other with the definition of the word. Topics of the cards include mostly...
Curated OER
Range and Mode
Students interpret data from graphs. In this range and mode lesson, students review a tally chart, pictograph and bar graph. Students use these graphs to calculate the range and mode of each set of data.
Curated OER
Colors Samples
For this math worksheet, students take the time to count out the colors of the candies. They graph the results and make inferences from the information.
Curated OER
Graph Activity
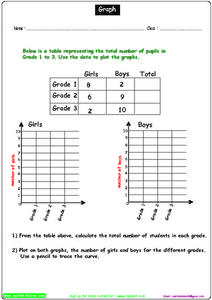
In this graphing learning exercise, students complete a data table, then use the data to draw a set of 2 graphs, calculate totals and plot numbers on both graphs.
Curated OER
Critter Encounter Chart
Students record data found at an assigned web site. In this data collection lesson, students access an assigned web site in order to complete a data chart about animals they see. They travel to different sections of the web site to find...
Curated OER
Biomes: Precipitation Graph
Students practice graphing by studying biomes. In this precipitation instructional activity, students graph the precipitation patterns for the 7 biomes on Earth. Students view a PowerPoint presentation in class which explores the 7...
Curated OER
How Big Is Your Head?
Students explore measurement by measuring classmates' heads. They record their measurements and they put the measurements in order from smallest to largest. Students figure the mean, median, mode, maximum, minimum, and range of their...
Curated OER
Mathematics Within: Bar And Pie Graphs
Students compare and contrast the use of bar and pie graphs with the same data. They create a data set by surveying all students in the class using sticky notes to make a table on the board. Then, each student creates a bar and pie graph...
Curated OER
Lyrics Statistics
Students describe, analyze and generalize relationships, patterns, functions using words. symbols, variables, tables and graphs.
Curated OER
Graphing on a Coordinate Grid
Students work in groups to create a graph on a coordinate grid. In this graphing lesson plan, students analyze data and put it into their graph by plotting points.
Savvas Learning
Saxon Math 5/4
You'll never have to search for another worksheet again after downloading this extensive collection of Saxon math materials. With over 600 pages of example problems and skills practice exercises, this is a must-have resource for any...
Curated OER
"who Lives in Your House?"
Fourth graders collect data about the people and animals living in their homes, and the students' shoe sizes. They work in groups to enter the information into a database from which they create graphs. They analyze the data to find the...
Curated OER
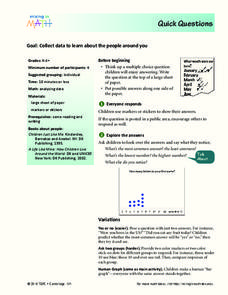
Quick Questions
Students ask their classmates survey questions. In this survey lesson, students come up with a question and possible answers. Their classmates mark their answers and the class discusses what they notice.
Curated OER
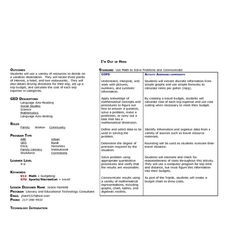
I'm Out of Here
Young scholars create a travel budget. In this budget lesson, students research vacation destinations. Working independently, young scholars research destinations on the Internet and construct a budget for the vacation. Resources provided.


