Curated OER
All in the Family
Students use data to make a tally chart and a line plot. They find the maximum, minimum, range, median, and mode of the data. Following the video portion of the lesson, students will visit a Web site to test their data collection skills...
Curated OER
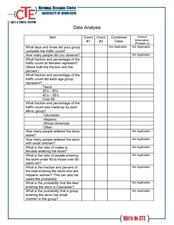
Data Analysis
In these data analysis worksheets, learners complete 4 worksheets of activities for analyzing data. Students use the mean, median, mode, and range to organize the data.
Curated OER
Data Handling: Bar Chart Showing Frequency
In this bar graph learning exercise, students analyze a bar graph showing soccer goals scored. Students then use the data to solve 7 problems.
Curated OER
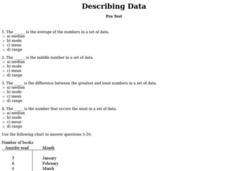
Describing Data
For this data worksheet, students complete multiple choice questions about mean, median, mode, and range. Students complete 10 questions total.
Curated OER
How to Draw a Bar Chart Correctly
Your class has gathered their data, so what's the next step? They need to display and analyze their data, and a bar chart is a perfect tool for the job. This resource provides the step-by-step instructions those kids need to construct a...
National Security Agency
Line Graphs: Gone Graphing
Practice graphing and interpreting data on line graphs with 36 pages of math activities. With rationale, worksheets, and assessment suggestions, the resource is a great addition to any graphing unit.
Curated OER
Unit 5: Order Whole Numbers in the 100s and 1,000s
There are three quick number ordering activities here for your mathematicians. First, they analyze data on the number of three types of pies sold. Scholars choose from four ordered lists the one showing fewest to most sold. Then, they...
American Institutes for Research
Digital Smiles
Explore metric measurement, recording data, and creating an electronic spreadsheet displaying results with your math class. Scholars will measure the length of their smiles, record the measurements, and represent the results on an...
Newspaper Association of America
Power Pack: Lessons in Civics, Math, and Fine Arts
Newspaper in Education (NIE) Week honors the contributions of the newspaper and is celebrated in the resource within a civics, mathematics, and fine arts setting. The resource represents every grade from 3rd to 12th with questions and...
Curated OER
Building Brilliant Bar Graphs
Everything you need for a mini-unit on bar graphs is included in this lesson plan! It outlines three lessons and includes worksheets. Learners taste pretzels, shoot baskets (switching off hands), and grab candy, graphing results...
Curated OER
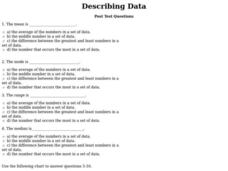
Describing Data
In this describing data worksheet, students answer multiple choice questions about mean, median, mode, and range. Students complete 10 questions total.
Curated OER
Tables and Data #3
In this tables and data instructional activity, students use a data table to answer a set of 8 questions. A website reference for additional activities is given.
Curated OER
Range, Mean, Median, Mode
Students research the impact of craters. For this range, mean, median and mode lesson, students complete an experiment with a marble to simulate the effects of a crater. Students collect and analyze data finding the range, mean, median...
Curated OER
Planning a Trip
Learners collect data, organize data, and compute differences of multi-digit numbers. In this data analysis lesson, students put together their best travel plan in small groups as outlined in the first lesson. Learners study a map,...
Curated OER
Populations and Life Cycles
Students explore biology by researching ocean statistics. In this data analysis instructional activity, students conduct a snail examination experiment utilizing live pouch snails. Students collect data about the snails over the course...
Curated OER
Rescue Mission Game
Young scholars conduct probability experiments. In this rescue mission instructional activity, sudents play a game and collect statistical data. They organize and interpret the data and determine the probability of success. Students...
Curated OER
State Data
Young scholars select ten states and use the number of letters in each state name as their data. In this measures of central tendency lesson, students find the mean, median and mode of the number of letters in their selected state names....
Curated OER
Flicking Football Fun
Young mathematicians fold and flick their way to a deeper understanding of statistics with a fun, hands-on math unit. Over the course of four lessons, students use paper footballs to generate data as they learn how to create line...
Curated OER
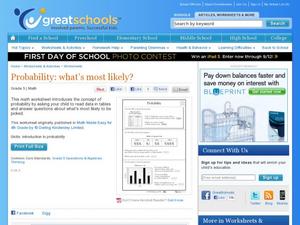
Probability: What's Most Likely?
Work with graphs, tally marks, and probability. Fifth graders read tables with different sets of data, including tally marks and a bar graph, to answer five questions. Use this worksheet as part of a probability lesson, or as a homework...
Curated OER
Graphing Rainforest Data
In this graphing worksheet, students graph 2 sets of rainforest data, labeling the horizontal and vertical axis properly and titling each graph.
Curated OER
Data Analysis
In this data analysis worksheet, students complete several activities to analyze data. Students calculate the mean, median, mode, and range for the 14 problems.
Curated OER
Explore: Collect And Organize Data
In this exploring how to collect and organize data worksheet, students, working with a partner, problem solve the answers to seven word problems involving data.
Curated OER
Piles of Paper
Track how much paper their class uses in a week. They will pile their used paper into one place, each day the pile is measured. They make predictions about how much paper they would collect in a month, then recycle the paper.
Alabama Learning Exchange
Keep It Movin'!
Learners conduct an experiment to study friction. They complete a KWL chart on friction and conduct an activity about the amount of friction on a moving object. To conclude, pupils create a table or graph of the data collected and they...
Other popular searches
- Data Sets Data Collection
- Linear Data Sets
- Comparing Two Data Sets
- Quadratic Data Sets
- Data Sets and Graphs
- Compare Related Data Sets
- Experiments and Data Sets
- Correlation of Data Sets
- Create Data Sets
- Circle Graph Data Set
- Compare Data Sets
- Compare Two Sets of Data


