Beacon Learning Center
Line Plots
Introduce line plots, show examples of tables, graphing on a number line, and engage in a class discussion. Share the process by which statistical data is organized and displayed on a number line. Examples and worksheets are included....
Mathed Up!
Tallys and Charts
After watching a brief instructional video, young mathematicians are put to the test. By completing and reading frequency tables, tally charts, and bar graphs, individuals show their understanding of how to interpret data.
ARKive
Handling Data: African Animal Maths
Handling and processing data is a big part of what real scientists do. Provide a way for your learners to explore graphs and data related to the animals that live on the African savannah. They begin their analysis by discussing what they...
Curated OER
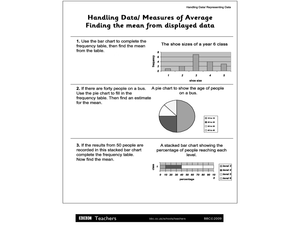
Handling Data/Measures of Average - Finding the Mean from Displayed Data
In this mean and average worksheet, students use the bars and charts to help them find the means using the given data. Students solve 3 problems.
Curated OER
Math--Pictures and Bars--Learning About Graphs
What is a graph? What does it tell us? How do you make one? These are all questions that are answered in the included packet. It's a great introduction to graphing for young learners!
Curated OER
Data Handling: Bus Charts
In this data display and analysis worksheet, students study a bar graph that shows the number of people who ride the bus at different times of day. Students use the graph to solve 6 problems. Note: Bus times are shown in 24 hour clock time.
Curated OER
WHAT IS THE POPULAR COLOR?
Fourth graders graph cars according to their colors. They complete the graph including a title, scale, x-axis, and y-axis. Students collect the data and choose the type of graph to be made.
Curated OER
Dealing With Data
Students collect, organize, and display data using a bar graph, line graph, pie graph, or picture graph. They write a summary describing the data represented and compare the graph to another graph in the class.
Curated OER
Now That's Using Your Head!
Explore linear measurement. Scholars will measure the circumference of their head and the distance they can jump. Information is recorded, averages are calculated, and a data table is completed. They then determine possible relationships...
Curated OER
Then and Now
Students conduct research and use census data to compare different times and places. In this census lesson, students interpret data from charts and graphs, comparing census information from two time periods as well as from two different...
Utah Education Network (UEN)
The Human Line Plot
Learners collect data and use charts and line plots to graph the data. Some excellent worksheets and activities are embedded in this fine lesson on line plots.
Curated OER
Physical Science: Festival of Bubbles
Investigate bubbles through the use of scientific inquiry. Pupils blow bubbles using several methods and measure the resulting bubble print. Measurements are recorded on a data table and transferred to a bar graph. Results are discussed...
Curated OER
The Numbers Tell the Story
Students demonstrate how to gather and interpret statistical data. In this data analysis lesson, students search for statistics on the health effects of smoking and place the information into charts. Students create these charts online...
Curated OER
What Are Your Favorite Apples?
In this tally worksheet, students take a survey to determine the favorite apple. They write tally marks beside the apple chosen. For elementary students, this worksheet may be used for counting purposes and to reinforce what a tally mark...
Curated OER
Learn How to Graph
Young scholars examine various types of charts and discover how to construct a line graph. Using graph paper, they construct a graph displaying weight loss over a five-year period. They draw copnclusions from the completed graphs.
Curated OER
Organize Data
In this organizing data worksheet, students complete the tally chart for 'Votes for Team Mascot' and then use the chart to answer the six questions.
Curated OER
My Test Book: Tally Charts
In this online interactive math worksheet, students solve 10 problems that require them to read and interpret tally chart data. Students may submit their answers to be scored.
Curated OER
Graphing with Stems-and -Leafs
Fourth graders examine the use of stem and leaf graphs. In this stem and leaf graph activity, 4th graders participate in teacher led activity showing the use of the graphs. They work in groups to collect data about peanuts before making...
Curated OER
Applied Science - Science and Math Lab
Students make a prediction. In this applied science lesson plan, students guess the number of items in a jar. Students create a bar graph to show the predictions and the actual amounts.
Curated OER
Plotting Data on a Graph
Learners investigate graphing. In this graphing lesson, students survey the class and create graphs to reflect the data collected.
Curated OER
Usage and Interpretation of Graphs
Students explore graphing. In this graphing instructional activity, students predict how many shoe eyelets are present in the classroom. Students count eyelets and work in groups to organize and chart the data collected. Students put all...
Curated OER
Favorite Candy Bar Graph
Students decide on six different types of candy bars to include in a data collection activity. Working in small groups, they survey a target group in a set amount of time. They access a Internet based graphing tool to create a bar graph...
Curated OER
Creating Graphs from Tables
Students interpret data from tables and then create a graph to show the same data in a different organization.
Curated OER
Level III: Technology Integration
Fourth graders prepare two spreadsheets each with an embedded line graph that displays data about the growth of the bitter rot fungus on apples and on petri dishes that were stored in the refrigerator and the classroom. They prepare a...


