Curated OER
Eat Your Veggies
Students investigate displaying data. In this displaying data lesson plan, students use tallies to count data about food preferences. Students use various types of graphs such as bar graphs, picture graphs, box-and-whisker plots, etc...
Curated OER
M&M Graphing and Probability
Students sort, classify, and graph M & M's. They create pictographs and bar graphs with the colors and numbers in each bag of M & M's. They calculate the ratio and probability based on class results.
Curated OER
Graphing With Candy
Students gather information and interpret the results using a tally chart, a table, and a bar graph.
Curated OER
Creating a Spreadsheet and Graph
Students create graphs in Excel. In this spreadsheet lesson, students input data into spreadsheet cells then use the graphing feature of the Excel program to produce colorful graphs of the data. The directions to create the graph are...
Curated OER
Misleading Graphs
Students explore number relationships by participating in a data collection activity. In this statistics lesson, students participate in a role-play activitiy in which they own a scrap material storefront that must replenish its stock....
Curated OER
Color Tile Graphing
Students explore data. They gather data and generate questions about the data in pictographs, tallies, tables, and bar graphs. Students use color tiles pulled by random to create their own bar graph. They discuss the bar graphs they...
Curated OER
Getting A Grip On Graphs
Fourth graders investigate the concept of graphing and comparing different types of data using pictographs, line graphs, scatter plots, etc... They gather data and make interpretations while examining the medium of how it is displayed.
Curated OER
Data Display
Students explore different ways to display data. In this statistics lesson, students create pie charts, bar graphs and line graphs to show data. Students then write a paragraph discussing which types of graphs are helpful for different...
Curated OER
Usage and Interpretation of Graphs
Students explore graphing. In this graphing lesson, students predict how many shoe eyelets are present in the classroom. Students count eyelets and work in groups to organize and chart the data collected. Students put all the data...
Curated OER
The Life Cycle of the Mealworm
Fourth graders provide a habitat for live mealworms and observe their life cycle. In this animal life cycle and scientific inquiry lesson, 4th graders create a habitat for a live mealworm and observe and record related data as it grows....
Curated OER
Dealing With Data
Students collect, organize, and display data using a bar graph, line graph, pie graph, or picture graph. They write a summary describing the data represented and compare the graph to another graph in the class.
Curated OER
Handling Data: Representing Date - Online Version
Here is an online lesson plan on data representation. In it, learners access websites embedded in the plan which lead them through a variety of activities around data representation and statistics. The activities are quite good, and...
Curated OER
Valentine Candy Count
Here is an imaginative take on a classic lesson! Young scholars discover what color Valentine Candy is found more often than any other in a standard bag of Valentine Conversation Hearts. They observe, predict, sort, and classify the data...
Curated OER
Classroom Census (Analyzing Data)
Students create graphs. For this data analysis lesson, students fill out a student census and then use the data collected to produce graphs. Students write paragraphs interpreting the data.
Curated OER
Graphs and Spreadsheets
Students collect data and present it in a graph and/or a spreadsheet, depending on their previous understanding of technology.
Curated OER
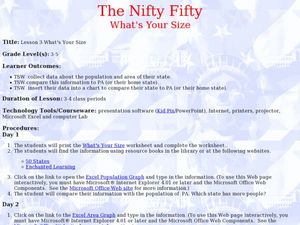
The Nifty Fifty-What's Your Size?
Students explore state populations. In this state geography lesson, students use a variety of technology tools to research and graph population and area of assigned states.
Curated OER
Valentine Candy Count
Students analyze a bag of Valentine candy to create a graph. For this graphing lesson, students make predictions, sort by color, record data and make a graph. Students discuss results and make generalizations. Students generate their own...
Curated OER
Survey Says...
Young statisticians collect, organize, and present data to illustrate responses to a survey question. They write and conduct the survey. They finish by presenting the results in the form of a graph.
Alabama Learning Exchange
How Old is Your Money?
Elementary learners explore coin mint dates. First, they listen to the book Alexander Who Used to be Rich Last Sunday by Judith Viorst. They then sort a collection of coins according to their mint date and put them in order from oldest...
Beacon Learning Center
Line Plots
Introduce line plots, show examples of tables, graphing on a number line, and engage in a class discussion. Share the process by which statistical data is organized and displayed on a number line. Examples and worksheets are included....
Curated OER
Applied Science - Science and Math Lab 4B
Learners experiment with the combination of vinegar and baking soda. In this applied science instructional activity, future scientists compare qualitative and quantitative data collected from their exploration. Then they work together to...
Curated OER
I Will Meet You In The Middle
Students use the 50 States Quarter Reversal as a context of learning a curriculum concept based from the state of Utah. They research the concepts of cause and effect. Also, they use customary units of measurement to find length and...
Curated OER
Dealing with Data in Elementary School
Students follow the scientific method in collecting data. In this following the scientific method in collecting data instructional activity, students develop a question they would like answered such as how many aluminum cans are...
Curated OER
Populations and Life Cycles
Students explore biology by researching ocean statistics. For this data analysis lesson, students conduct a snail examination experiment utilizing live pouch snails. Students collect data about the snails over the course of six weeks and...


