Math Moves U
Collecting and Working with Data
Add to your collection of math resources with this extensive series of data analysis worksheets. Whether your teaching how to use frequency tables and tally charts to collect and organize data, or introducing young mathematicians to pie...
Scholastic
Study Jams! Pictograph
An easy and fun way to look at data is with a pictograph. A lesson plan friendly enough for multiple grade levels shows how to set up this graph with a corresponding key. The steps review the importance of choosing an appropriate...
Curated OER
Data Analysis, Probability, and Discrete Mathematics
Fourth graders analyze the data in a bar graph, pictograph, line graph, and a chart/table and draw conclusions based on the data. They discuss each type of graph, write questions for each graph, and analyze the data as a class.
Curated OER
Dealing With Data
Learners collect, organize, and display data using a bar graph, line graph, pie graph, or picture graph. They write a summary describing the data represented and compare the graph to another graph in the class.
Curated OER
Choose a Graph to Display Data
In this math graphs worksheet, students write line plot, tally chart, pictograph, or bar graph to tell the best kind of graph to use to answer the six questions.
Curated OER
Organizing And Reading Data
Learners complete three parts of an "Organizning and Reading Data" worksheet. First, they go over the rubric to determine the work will be scored. They organize data by taking tallies, make a pictograph and a bar graph using the data....
National Security Agency
Line Plots: Frogs in Flight
Have a hopping good time teaching your class how to collect and graph data with this fun activity-based lesson series. Using the provided data taken from a frog jumping contest, children first work together creating a line plot of the...
Curated OER
All in the Family
Students use data to make a tally chart and a line plot. They find the maximum, minimum, range, median, and mode of the data. Following the video portion of the lesson, students will visit a Web site to test their data collection skills...
Worksheet Web
Using Pictographs
If one ice cream cone represents three ice cream scoops, and Bob has four ice cream cones, then how many scoops does Bob have? Learners solve these kind of questions with their new understanding of pictographs.
Curated OER
Data Handling: Pictogram of Birds
In this pictograph problem solving activity, students analyze a pictograph of birds seen each day for a week. They use the information on the graph to solve 6 problems.
Curated OER
WHAT IS THE POPULAR COLOR?
Fourth graders graph cars according to their colors. They complete the graph including a title, scale, x-axis, and y-axis. Students collect the data and choose the type of graph to be made.
Curated OER
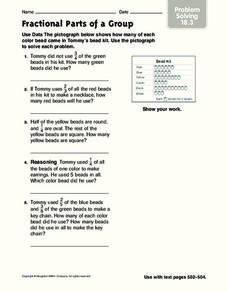
Fractional Parts of a Group
In this problem solving worksheet, students problems solve the answers to 5 mathematical word problems involving fractional parts. Students use data from a pictograph to assist them in solving each word problem.
Curated OER
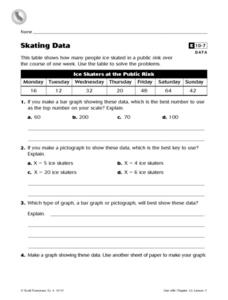
Skating Data
For this collecting data worksheet, 4th graders view a table on ice skaters at a public rink in order to answer 2 multiple choice questions, 1 short answer question and make a graph showing one piece of the data.
Curated OER
Organizing Data Using Tables and Graphs
Students create graphs and tables, as well as interpret and make inferences from the data shown to determine when and where graphs and tables are most useful.
Curated OER
State Data
Young scholars select ten states and use the number of letters in each state name as their data. In this measures of central tendency lesson, students find the mean, median and mode of the number of letters in their selected state names....
Curated OER
Read a Picture Graph
It's the Bears vs. the Seals! Who is the season winner? Read this data and have your math class answer the six questions that follow. Consider graphing the chart as a class, or encouraging individuals to graph it before answering the...
Curated OER
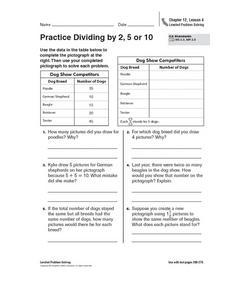
Practice Dividing by 2, 5, or 10
In this pictograph problem solving worksheet, students analyze the data on a table and create a pictograph. Students read and solve 6 story problems about the pictograph.
Curated OER
Special Ed. Resource
Ways to organize data is the focus of this math PowerPoint. Students view slides that define and give descriptions of a variety of graphs, and how mean, median, and mode are found. A good visual tool which should benefit almost all types...
Curated OER
Survey Says...
Young learners create and implement a school-wide survey about student body favorites! Learners record and analyze the data on a bar graph, picture graph, and line graph, and then display the data. Then, wrap it all up with a celebration...
Curated OER
Color Tile Graphing
Students explore data. They gather data and generate questions about the data in pictographs, tallies, tables, and bar graphs. Students use color tiles pulled by random to create their own bar graph. They discuss the bar graphs they...
Curated OER
Getting A Grip On Graphs
Fourth graders investigate the concept of graphing and comparing different types of data using pictographs, line graphs, scatter plots, etc... They gather data and make interpretations while examining the medium of how it is displayed.
Curated OER
Getting A Grip On Graphs
Fourth graders gather variety of data and create a graphs to display the data.
Curated OER
Getting There
Students practice reading a pictograph. In this data analysis instructional activity, students collect data and create their own pictograph. A students worksheet is included.
Curated OER
Math--Pictures and Bars--Learning About Graphs
What is a graph? What does it tell us? How do you make one? These are all questions that are answered in the included packet. It's a great introduction to graphing for young learners!


