Curated OER
Math: Methods of Measurement
Fourth graders practice linear measurement skills by applying various measuring instruments to determine the heights of classmates. By measuring the heights of second graders and fourth graders, they construct tables of height and age...
Houghton Mifflin Harcourt
Unit 5 Math Vocabulary Cards (Grade 4)
A set of 49 cards can enhance fourth graders' math vocabulary. It provides a pair of cards on each sheet, one with the word printed in bold text, and the other with the definition of the word. Topics of the cards include mostly...
Curated OER
How Big Is Your Head?
Students explore measurement by measuring classmates' heads. They record their measurements and they put the measurements in order from smallest to largest. Students figure the mean, median, mode, maximum, minimum, and range of their...
Curated OER
Bar Graphs
In this bar graphs worksheet, pupils, working with a partner, explore how to read and analyze the five answers to one mathematical bar graph.
Alabama Learning Exchange
How Old is Your Money?
Elementary learners explore coin mint dates. First, they listen to the book Alexander Who Used to be Rich Last Sunday by Judith Viorst. They then sort a collection of coins according to their mint date and put them in order from oldest...
Curated OER
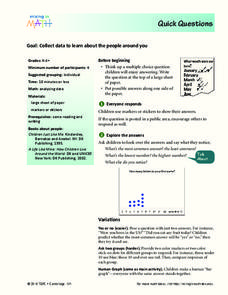
Quick Questions
Students ask their classmates survey questions. In this survey lesson, students come up with a question and possible answers. Their classmates mark their answers and the class discusses what they notice.
Curated OER
Mathematics Within: Bar And Pie Graphs
Young scholars compare and contrast the use of bar and pie graphs with the same data. They create a data set by surveying all students in the class using sticky notes to make a table on the board. Then, each student creates a bar and pie...
Curated OER
Getting to Know You
Students create survey questions for their classmates. In this survey lesson, students pick a yes or no question and find what fraction of the class responded yes. They discover how the wording of a survey question can affect the answer.
Curated OER
Shadow Chasing
The students compare themselves and their shadows to various objects big and small. Students use their data to set up proportions to solve.
Curated OER
Introduction to Lego Robotics
Students utilize computer programs to operate a simple robot. In this technology instructional activity, students create robots using Lego pieces and simple motors to move them. Students measure the speed of the robots by running...
Curated OER
Involving Community Members, Parents, and Community Agencies in Student Learning
Students predict and estimate the number of moose shot by people between the years of 1986-1990. They analyze data and statistics, construct bar graphs, and conduct research on the Alaskan moose.
Curated OER
High and Low Tides
Students collect real world data from the Web regarding high and low tides at various locations in the United States. They find a function which models this data and make predictions on tide levels based on the information found.
Curated OER
Investigating the Probability
Learners investigate probability using coins and dice. They collect data, graph, organize and interpret data. They predict, describe, compare, compute and draw conclusions based on what they observe and record.
Curated OER
Force and Gliders
Students explore physics by creating data graphs in class. In this flight properties lesson plan, students read the book Flying Machine and identify the force, resistance and construction necessary to keep a glider in the air. Students...
Curated OER
Millions, Billions, Trillions
Students use real-world data to compare the relative sizes of millions and billions, and exponential growth. They use the salaries of famous people such as, Michael Jordan and Bill Gates to understand this math concept.
Curated OER
Range and Mode
Students interpret data from graphs. In this range and mode lesson, students review a tally chart, pictograph and bar graph. Students use these graphs to calculate the range and mode of each set of data.
Noyce Foundation
Time to Get Clean
It's assessment time! Determine your young mathematicians' understanding of elapsed time with this brief, five-question quiz.
Curated OER
Olympic records through time
Students compare the records of gold medal Olympic winners for the last 100 years and decide if we are faster, stronger than in the past.
Curated OER
Greenhouse Effect ...Building Our Own
Students explore the greenhouse effect. They set up a simplified model of the earth and the greenhouse effect. Students compare temperatures inside a jar to temperatures outside the jar. Pupils collect information and create a line...
Curated OER
Does Sunlight Effect Leaf Size?
Students make estimates and then measure leaves for accuracy. They calculate the area of the leaves by drawing an outline on graph paper and counting the squares. They compare the leaves exposed to sunlight to those that are in constant...
Curated OER
Population Ratios
Students access web site and record various population statistics pertaining to a county in the USA of their choice. They use this data to set up and solve ratios. They compare data to make meaning of the numbers.
Curated OER
Graphing
Students collect data to create different types of graphs-line, pie, and bar graphs. They use StarOffice 6.0 to create graphs.
Curated OER
Sunrise/Sunset
Learners apply data from a weather-related website to predict patterns in the sunrise and sunset.
Curated OER
Guess My Piece -working with Legos
Students participate in guessing their partners' hidden Lego pieces from their verbal clues. They work in partners to accomplish their goals. They are meeting a variety of math standards by completing this lesson.


