Mixing In Math
Mixing in Math: Growing Plants
Whether you have your class plant seeds or begin when sprouts are visible, math skills are used here to predict and track growth over time. Straw bar graphs show plant height on a given day while the graph as a whole shows changes over...
Curated OER
Graphing Lesson Plans
By using hands-on graphing lesson plans students can learn how to collect data, and display the information using graphs.
Curated OER
Let's Graph It! Pre-Test
In this graphing worksheet, students complete a set of 10 multiple choice questions, clicking on a link to see correct answers or print the page.
Curated OER
Trees For Trout!
Fourth graders determine the impact of native forests, local clearcuts and local clearcuts and local reforestation projects on the survivablity of Rainbow Trout in their area. They record and document the stages of the trout throughout...
Curated OER
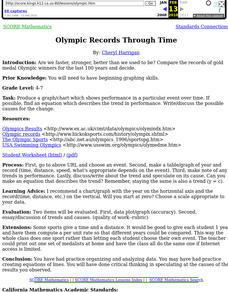
Olympic records through time
Young scholars compare the records of gold medal Olympic winners for the last 100 years and decide if we are faster, stronger than in the past.
Curated OER
Food for Thought
In this food facts activity, 4th graders read and interpret a short history on tin cans, Wonder Bread, ToastMaster, Nicolas Appert and Charles Strite. Students answer five word problems.
Curated OER
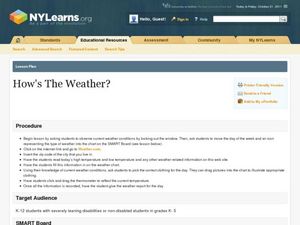
How's the Weather
"How's the Weather?" is an exercise that combines science and math as students graph the weather along the Iditarod Trail. They complete a double-line graph of the weather of a chosen checkpoint over the course of one week. Students...
Curated OER
Finding the Salt Front
Young scholars discuss definitions of estuary, salinity, and the salt front. They listen as the teacher explains the Hudson River Miles and ways the upriver and downriver sections relate to the north and south. Students graph the salt...
Curated OER
Let's Graph It
For this let's graph it worksheet, student interactively answer 10 multiple choice questions about graphing data and types of graphs, then click to check their answers.
Curated OER
Graph Made Easy-Pre Test Questions
In this graphing pre test worksheet, students complete a set of 10 multiple choice questions. Page is labeled as a pretest, an answer link is provided.
Curated OER
Archaeology: Digging in the Classroom
Learners explore how an archaeologist works and makes discoveries. In this archaeology lesson, students participate in a simulation in which they excavate broken pottery. Learners use measurement, geometry, and observation skills during...
Curated OER
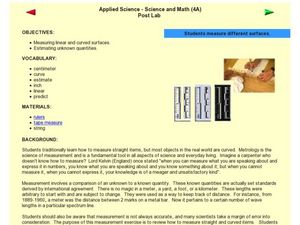
Measuring Different Surfaces
Fourth graders investigate measurement of linear and curved surfaces. In this math lesson, 4th graders discuss how to measure curved surfaces and work with a partner to measure various curved surfaces.


