Curated OER
Life Expectancy at Birth
Students create a line graph on the life expectancy for males and females in Canada. In this math and health lesson plan, students review table and graph terminology, create line graphs, and analyze the differences in life expectancy...
Curated OER
When Dinosaurs Ruled the World
Students graph the varying sizes of dinosaurs. In this math and dinosaur lesson, students view dinosaur models and compare the different shapes and sizes of the dinosaurs. Students complete a dinosaur math activity, read The Dinosaur...
Curated OER
Graphing Toys!
Jason, Michelle, Sofia, and Willis all have a variety of toys. Use the chart provided to graph how many toys each child has. Who has the most toys? Who has the least? Help your learners study the graphs they create to better understand...
Curated OER
Tally Time
Students create a tally chart. In this math and health lesson, students discuss healthy foods and create a tally chart showing the number of students who like to eat healthy foods.
Curated OER
"M&M's"® Candies Worksheet 2
In this math worksheet, learners plot the mean, median, and mode for the colors of M and M candies by filling in the graphic organizer.
Curated OER
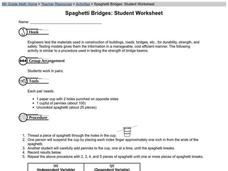
Spaghetti Bridges: Student Worksheet
Pairs of learners work together in order to simulate how engineers test materials for strength and safety in the real world. They use paper cups and pieces of spaghetti to run strength tests. This excellent activity should lead to...
Curated OER
Pick A Number
Elementary schoolers find out which month has the most class birthdays (mode) and which birthday represents the middle point of all the birthdays (median). They gather and organize data to find one number that fairly represents the whole...
Curated OER
Lesson Plan for Cricket's Supper
Interested in a special folktale to read with your class? Then this lesson might be for you. Readers will build an understanding of the food chain while creating a storyboard that includes the characters, setting, and plot of the story....
Curated OER
Picket Fence Around the Garden
Students design different shaped plots and determine the perimeter, area and shape of each. They compare the shapes that have the same area but may have different perimeters.
Curated OER
The Estimation Station
Students challenge "common knowledge" against newly learned estimation strategies and put those strategies into use. They consider variables in estimating different groups of objects and practice skills of representing numbers.
Curated OER
Drops on a Penny
Young scientists explore the concept of surface tension at is applies to water. In this activity, learners use a dropper to place drops of water on a penny. Each group guesses how many drops a heads-up penny will hold, then conducts the...
Curated OER
Generate Measurement Data Word Problems
Beginning graphers will appreciate this practice with basic bar graphs. For each table of data, there is a corresponding graph for learners to match it to. The five data sets all have the same two factors: days and numbers. Although this...
Curated OER
"M&Ms"® Candies Worksheet 1
In this math worksheet, students find the likelihood of different outcomes with the use of M and M's candy for the seven questions and fill in the graphic organizer.
Purdue University
The Represented World: Recreational STEM
How are forces and motion important to a swing set? Scholars explore the concepts of force and motion using swing sets. In preparation for their own STEM design project, individuals take surveys and data from peers, complete labs on...
Curated OER
Graphing Ordered Pairs
In this math worksheet, students learn to graph ordered pairs. Students examine a graph with 3 labeled points and tell the ordered pairs for each. Students also plot 8 ordered pairs on a graph they draw themselves.
Curated OER
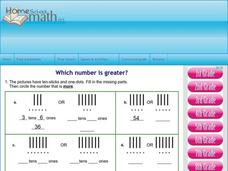
Which Number is Greater?
Students draw pictures of two digit numbers to identify the greater value. In this math activity, students plot two digit numbers on a number line and identify the greatest or lesser value. Students use the greater than and less than...
Alabama Learning Exchange
Keep It Movin'!
Learners conduct an experiment to study friction. They complete a KWL chart on friction and conduct an activity about the amount of friction on a moving object. To conclude, pupils create a table or graph of the data collected and they...
Alabama Learning Exchange
Jelly Beans Add Up
Students explore counting, sorting, and graphing skills. In this data analysis lesson plan, students sort jelly beans by color, count the jelly beans, and create a bar graph of the jelly beans according to color.
Alabama Learning Exchange
How Old Is That Tree?
Fifth graders study environmental changes by examining the annual rings of a cross-section of a tree trunk. They access websites to complete a worksheet on the parts of a tree. They count the annual rings on a tree slice while observing...
Curated OER
Download and Analyze
Students download information from a NASA website into a database. They transfer it to a spreadsheet by completing the information and analyze the information. They determine temperature averages, mode, and graph the results. They write...
Curated OER
State Data
Students select ten states and use the number of letters in each state name as their data. In this measures of central tendency lesson, students find the mean, median and mode of the number of letters in their selected state names. They...
Curated OER
Algebra: Co-ordinates
Learners use Cartesian coordinates. In this graphing lesson students use simple formulae, interpret coordinates, and create graphical representations. They express their work algebraically.
Curated OER
Coordinating Coordinates
Third graders explore coordinate pairs and coordinate grids. They use a grid on which each letter of the alphabet is assigned a coordinate pair, 3rd graders decipher a coded message. Pupils compare coordinate pairs on a coordinate grid...
Curated OER
Calculating Total From Percents
Using this short review of finding a percentage of a number, learners can practice important skills. There are twelve questions on this worksheet.


