Curated OER
Graphing Favorite Holidays
Students create spreadsheets and bar graphs based on results of survey of favorite holidays.
Curated OER
How Much Will I Spend On Gas?
Students construct a linear graph. In this graphing lesson, students determine a monthly budget for gasoline. Students construct a t-chart and coordinate graph to display data. Resources are provided.
Curated OER
I'm Warm Now
Third graders graph how much water is wasted while waiting for it to get warm in the spigot in the sink. In this graphing lesson plan, student first predict how much water is wasted. That night they test it out at home and the next day...
Curated OER
Graphing Favorite Colors
Third graders collect data and insert it into ClarisWorks to create a spreadsheet/graph of their favorite color. They interpret the data together.
Curated OER
The First Strawberries
Young scholars explore Cherokee legends. They read The First Strawberries by Joseph Bruchac, and then do several activities to help comprehension. They discuss the book and answer comprehension questions. In addition, they retell the...
Public Schools of North Carolina
Math Stars: A Problem-Solving Newsletter Grade 1
Keep the skills of your young mathematicians up-to-date with this series of newsletter worksheets. Offering a wide array of basic arithmetic, geometry, and problem solving exercises, this resource is a great way to develop the critical...
Mixing In Math
Mixing in Math: Growing Plants
Whether you have your class plant seeds or begin when sprouts are visible, math skills are used here to predict and track growth over time. Straw bar graphs show plant height on a given day while the graph as a whole shows changes over...
Curated OER
Ice Cream Pictograph
Students create a graph. In this pictograph lesson, students cut out 20 small ice cream cones and decorate them. Students create a pictograph with their ice cream cones.
Curated OER
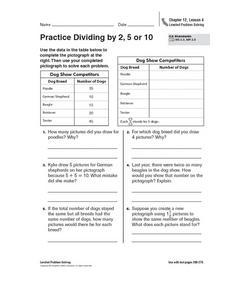
Practice Dividing by 2, 5, or 10
In this pictograph problem solving worksheet, students analyze the data on a table and create a pictograph. Students read and solve 6 story problems about the pictograph.
Curated OER
What's My Ratio?
Students investigate ratios of various objects. In this ratios of various objects lesson plan, students draw pictures on graph paper and then dilate or shrink the image. Students determine the ratio of their pictures. Students trade...
Curated OER
The Very Hungry Caterpillar
Read the story, The Very Hungry Caterpillar, and complete activities from multiple subjects. Make a mural, create a class graph, discuss the life cycle of a butterfly, research information about butterflies on the Internet and make a...
Education.com
Measure School Supplies
Ever wonder how long a pair of scissors are? Find out with this simple measuring activity in which pupils use the provided ruler to determine the length of four common classroom supplies.
Curated OER
Leaving on A Jet Plane
Students create an airplane by listening to directions. They also to measure the pieces for the airplane and compare and contrast their test flights.
Curated OER
Can you find the transportation?
Students locate and name different types of transportation. They categorize types of transportation by where you find them: land, air, or water. Students graph the information collected. Additional ideas are listed for cross curriculum.
Curated OER
A Christmas Place
In this graphing worksheet, students plot the points on the graph to create a picture of a Christmas tree. Students plot 37 points and connect them where told to.
Curated OER
Multiplying With Nine As A Factor
Elementary math minds complete various activities to memorize the multiples of nine. They watch a PowerPoint presentation and demonstrate the finger trick. Unfortunately the link to the multiplication activities does not take you...
Curated OER
Survey Surfing
Students survey other students and record the information on a chart using tally marks. They record their favorite fish and their favorite foods, and share the results with the class.
Noyce Foundation
Time to Get Clean
It's assessment time! Determine your young mathematicians' understanding of elapsed time with this brief, five-question quiz.
Curated OER
Yummy Apples!
Learners discuss apples and how they are grown. They listen as the teacher reads "Apples," by Gail Gibbons. Students discuss the story. They view several different types of apples and compare their characteristics. Learners taste several...
Curated OER
Quilts and Math
Students create a pattern. For this patterns lesson, students review the meaning of symmetry and explore using pattern blocks. Students look for patterns in real quilts, photographs and pictures. Students work independently to plan a...
Curated OER
Pumped Up Gas Prices
Students calculate gas prices. In this transportation lesson, students tally the mileage and gas costs of their car for one months. They figure out how much was spent on gas and create a graph showing average gas prices over time.
Curated OER
1st Geometry
In this geometry worksheet, learners choose the multiple choice answer to 15 questions involving several different elements of geometry.
Curated OER
Applied Science - Science and Math Post-Lab
Students explore optical illusions. In this Applied Science instructional activity, students view optical illusions and record the data of what they see. Students graph the data that they collect.


