Curated OER
Mental Math: Subtract Tens, Problem Solving
Subtracting by 10s is easy for your young learners with this worksheet! There are three questions to accompany a bar graph, and there's a space for learners to explain their answers. Encourage them to use mental math here!
Curated OER
Reading Bar Graphs
Working on bar graphs in your math class? Use a thorough worksheet to reinforce graphing and problem solving skills with your third graders. After reviewing two bar graphs, young learners answer ten questions about the data represented...
Curated OER
Reading Bar Graphs #2
Raise the bar in your third grade class with this learning exercise on bar graphs. Youngsters view three graphs representing three different sets of data, and answer questions based on what they analyze. The first set is completed as an...
Jude Mphoweh
Graphs
Searching for worksheets to include in an elementary math series on bar graphs? Then look no further! This collection of materials has exactly what you need to ensure that your students get plenty of practice reading and analyzing the...
Curated OER
Read and Make a Bar Graph
In this bar graph learning exercise, learners learn how to read bar graphs by using the information in each word problem and making bar graphs with the information to help solve the problems.
Curated OER
Double Bar Graphs - Homework 7.1
Your learners have seen basic bar graphs, but do they have experience reading double bar graphs? This worksheet details how to draw a double bar graph and provides an example with six accompanying questions. The final question asks...
Curated OER
Tim and Pat at the Store: Bar Graphs
Do you like candy? Tim and Pat go to the candy store every day after school. Can you use the chart to determine how much money they spend each day? Does one spend more than the other?
Baylor College
Air: The Math Link
Inflate this unit on the science of air with these math skills practice and word problems. Accompanying the children's story Mr. Slaptail's Secret, this resource covers a wide range of math topics including the four basic operations,...
Curated OER
Use a Graph
Information is often presented in graph form. Can your youngsters read a basic bar or picture graph? Six word problems accompany three graphs. One graph is a bar graph and the other two are pictographs.
Curated OER
Choose a Graph to Display Data
In this math graphs worksheet, students write line plot, tally chart, pictograph, or bar graph to tell the best kind of graph to use to answer the six questions.
Curated OER
Graphs to Represent a Data Set
Here are a some pre-made sets of data that kids can use to practice data analysis. There are 10 survey scenarios written out, and scholars synthesize the results of each into a bar graph. In addition to the graphing, they answer two...
Curated OER
Usage and Interpretation of Graphs
Cooperative groups are formed for this graphing activity. Each group must construct a graph that represents how many eyelets (the holes for laces in shoes), are present in their group. A whole-class bar graph is eventually constructed...
Curated OER
Generate Measurement Data Word Problems
Bar and line graphs are an excellent way to visually analyze data: give your scholars practice both analyzing graphs and creating their own! First, they examine five basic bar graphs, indicating the number of squares on specific days....
Curated OER
Use a Bar Graph: Practice
In this bar graph worksheet, students use data in a bar graph to solve 2 word problems, 2 mental math problems and 1 multi-step problem. Reference to a Houghton Mifflin text is given.
Baylor College
Living Things and Their Needs: The Math Link
Enrich your study of living things with these cross-curricular math activities. Following along with the story Tillena Lou's Day in the Sun, learners will practice addition and subtraction, learn how to measure volume and length, work on...
Curated OER
Graphing
Students collect data to create different types of graphs-line, pie, and bar graphs. They use StarOffice 6.0 to create graphs.
Curated OER
Build A Skittles Graph
Young scholars explore graphing. In this graphing lesson plan, students sort Skittles candies and use the color groups to create a bar graph. Rubrics and extension activities are provided.
Curated OER
Graphing With Candy
Students gather information and interpret the results using a tally chart, a table, and a bar graph.
Curated OER
Problem Solving Application: Using a Bar Graph
In this bar graph worksheet, students use a set of 2 bar graphs to answer 6 related questions. Answers are included on page 2. A reference web site is given for additional activities.
Curated OER
Easter Bar Graph- A
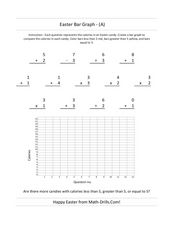
In this Easter math worksheet, students first solve 13 problems with addition, subtraction, multiplication and division. Using the answers, students make a bar graph.
Curated OER
Classroom Supplies
Challenge young mathematicians to buy classroom supplies by staying within the means of a $1,000 budget. The mathematical activity provides learners with the opportunity to decide what items from the supply list would benefit a class of...
Curated OER
Usage and Interpretation of Graphs
Students explore graphing. In this graphing instructional activity, students predict how many shoe eyelets are present in the classroom. Students count eyelets and work in groups to organize and chart the data collected. Students put all...
DK Publishing
Using Information in Tables
Find out how well can your second or third graders use tables to solve word problems by assigning this single-page worksheet. Two tables with different sets of data prompt learners to solve six problems. An example at the top of the page...
Curated OER
Wheat Kernels Bar Graph
Third graders create a bar graph to record how many kernels were in a wheat stalk. They write in math journals two questions from interpreting the graph. They solve math problems from other students.


