Curated OER
Complete the Graphs
First, second, and third graders make pictographs. There are four graphs to complete, and the answer sheet is included. Consider providing your learners with special needs two sets of stickers to use, instead of requiring them to draw...
Curated OER
Going Graph-y
Second graders listen to and dicuss the story Where the Wild Things Are. They play a pantomime game and act out various feelings so their classmates can guess. They listen for the frequency of certain words, and record their findings on...
Curated OER
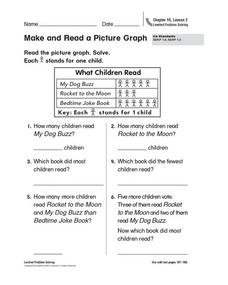
Make and Read a Picture Graph
What books do you like? Have your learners read and interpret a picture graph detailing a fictional class's favorite books. Consider conducting a survey of your learners' favorite books and plotting the results as a class!
Curated OER
Read a Picture Graph
It's the Bears vs. the Seals! Who is the season winner? Read this data and have your math class answer the six questions that follow. Consider graphing the chart as a class, or encouraging individuals to graph it before answering the...
Baylor College
Air: The Math Link
Inflate this unit on the science of air with these math skills practice and word problems. Accompanying the children's story Mr. Slaptail's Secret, this resource covers a wide range of math topics including the four basic operations,...
Curated OER
Graphs to Represent a Data Set
As your scholars begin to learn how to read graphs, help them pay attention to detail with this matching activity. They read four short data descriptions and match them to one of the four bar graphs pictured. Each graph is labeled along...
Baylor College
Living Things and Their Needs: The Math Link
Enrich your study of living things with these cross-curricular math activities. Following along with the story Tillena Lou's Day in the Sun, learners will practice addition and subtraction, learn how to measure volume and length, work on...
Curated OER
Using Graphs and Charts
Students complete T charts and manipulate numbers using graphs and charts. For this math graphs and charts lesson, students review the concepts of pattern and function. Students then complete practice pages where they manipulate numbers...
Federal Reserve Bank
Less Than Zero
Perry the penguin wants to buy a new scooter, but he doesn't have any funds! Walk your kids through the short book Less Than Zero, and have them track his borrowing, spending, and saving on a line graph while you read. Pupils will learn...
Curated OER
Creating and Reading a Pictograph
Second graders examine how data can be transferred into pictures on a pictograph. They analyze data on a graph about chewing gum, and create a pictograph that illustrates data about their preferences for the taste of bubble gum. ...
Curated OER
Picture Fists Full of Kisses
Ease children's back-to-school jitters with this primary grade lesson based on the book The Kissing Hand by Ruth E. Harper. Starting off with a singing of the song "I Wish I Had a Little Red Box", children go on to discuss and create a...
Curated OER
Food for Class Party
In this interpreting a bar graph and math word problems worksheet, 2nd graders read the information about choices of food for a class party and answer various multiple choice questions. Students solve 25 problems.
Curated OER
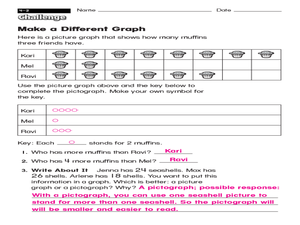
Make a Different Graph
What is the difference between a picture graph and a pictograph? Young learners are given a picture graph detailing how many muffins three friends have, and they must complete a pictograph using a symbol of their choice. An answer key is...
Curated OER
Jellybean Graphs
Second graders predict and graph data based on the color of jelly beans they think are in a handful. In this prediction lesson plan, 2nd graders will predict how many of each color jellybean are in a handful. Then they graph these...
Curated OER
THE EASTER BUNNY GETS READY! PICTURE GRAPH
In this graphing worksheet, students read a picture graph about colors of Easter eggs and then answer questions about the graph.
Public Schools of North Carolina
Math Stars: A Problem-Solving Newsletter Grade 2
Develop the problem solving skills of your young learners with this collection of math newsletters. Covering a variety of topics ranging from simple arithmetic and number sense to symmetry and graphing, these worksheets offer a nice...
Learner
Solid Shapes
A collection of two lessons, kindergartners will identify two-dimensional shapes in solid shapes. They will develop basic knowledge of the components that make up a sphere, rectangular prism, pyramid, cylinder, cone, and cube. Young...
Curated OER
Graphing Family Reading Habits
Second graders collect data from their families about their reading habits and graph them. For this graphing family reading habits lesson, 2nd graders interview family members about their reading habits. They then use a graphing computer...
Curated OER
Graphing Favorite Holidays
Students create spreadsheets and bar graphs based on results of survey of favorite holidays.
Curated OER
Mathematics Lesson Plan
Second graders study subtraction facts. In this mathematics lesson, 2nd graders discuss how to solve two digit subtraction problems. Students recognize that there are many different methods or strategies one can use such as using...
Curated OER
The Very Hungry Caterpillar
Read the story, The Very Hungry Caterpillar, and complete activities from multiple subjects. Make a mural, create a class graph, discuss the life cycle of a butterfly, research information about butterflies on the Internet and make a...
Curated OER
Going My Way?
Students discuss how each one of them leaves school each day. They create and analyze a class graph displaying the information collected.
Curated OER
Bus Graph
Students make predictions about which bus takes the most/least students in the classroom. They use KidPix bus stamp for each student who goes home on that bus number and record data and discuss predictions.
Curated OER
Spiders! Scary or Nice?
Students participate in a variety of cross-curriculur activities in order to explore spiders.


