Heidi Songs
Zoo Animal Probability Graph
Capture the engagement of your young mathematicians with a collaborative graphing activity. Using a deck of zoo animal picture cards, students select a picture from the deck, record the chosen animal on a graph, and then replace the card...
Illustrative Mathematics
Hand Span Measures
How long is your hand span? Young mathematicians measure their hand span from pinky tip to thumb tip using a centimeter ruler. After rounding to the nearest whole centimeter, learners plot their data on a line plot.
Curated OER
Awesome Animals
Students collect data from classmates about their favorite animal. They use the ClarisWorks graphing program to enter data, graph results, and interpret data.
Curated OER
We Are Having a Party! Part I
Second graders use data analysis skills in order to plan a class party. They graph possible times for the party noting the range for times. They discuss how mathematicians find and use the range to analyze data.
Curated OER
Paper Tower Challenge
Student explore the challenge of building a tower using paper. They build their tower using paper and record the height of their tower. Students collect and record the heights of other towers and use that data to create a spreadsheet.
Curated OER
Displaying the Data
Students gather facts about their parent's families through the completion of parent interview forms. Using tally marks, the data gathered is counted, transferred to graphs and used to create family timelines.
Noyce Foundation
Digging Dinosaurs
Build a function to solve problems rooted in archeology. A comprehensive set of five lessons presents problems requiring individuals to use functions. The initial lesson asks learners to find the possible number of dinosaurs from a...
Noyce Foundation
Double Down
Double the dog ears, double the fun. Five problems provide increasing challenges with non-linear growth. Topics include dog ears, family trees and population data, and geometric patterns.
Curated OER
Creating and Reading a Pictograph
Second graders examine how data can be transferred into pictures on a pictograph. They analyze data on a graph about chewing gum, and create a pictograph that illustrates data about their preferences for the taste of bubble gum. ...
World Wildlife Fund
Graphs and Charts
A two-part worksheet incorporating bar graphs and pie charts, young mathematicians can practice their graphing skills. Pupils answer questions using graphs and charts but are also challenged to create their own using a given set of data.
Curated OER
Patterns Here, There and Everywhere
Pattern recognition is a skill often used in mathematics. Learners count and sort manipulatives, organize the data into a graph and answer questions about the information displayed. They collect the objects to be used and create patterns...
Curated OER
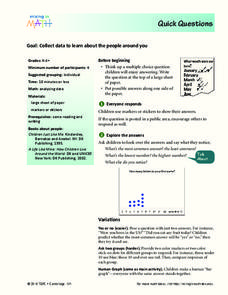
Quick Questions
Students ask their classmates survey questions. In this survey lesson, students come up with a question and possible answers. Their classmates mark their answers and the class discusses what they notice.
Curated OER
Skittle Graphing (Lesson Plan)
Pupils discuss the uses of graphs. They use color candies to count and sort before designing graphs. They label the graph papers with appropriate titles and candy colors. They complete the graph bars, and discuss the results with a...
Curated OER
Algebra: Sorting, Representing, and Patterns
Young scholars sort objects and create patterns. In this sorting and graphing lesson, students work at centers to find a way to sort a group of objects, then make a graphical representation of the number of each item. Finally, young...
Curated OER
Getting to Know You
Learners create survey questions for their classmates. In this survey activity, students pick a yes or no question and find what fraction of the class responded yes. They discover how the wording of a survey question can affect the answer.
Curated OER
Standard Units of Measure
Learners explore linear measurement. They choose appropriate measuring tools, measure three classroom items, and record their results. A class discussion ensues in which everyone decides the best way to present their data.
University of Kansas
Newspaper in the Classroom
Newspapers aren't only for reading—they're for learning skills, too! A journalism unit provides three lessons each for primary, intermediate, and secondary grades. Lessons include objectives, materials, vocabulary, and procedure, and...
Curated OER
Fast Food Survey Using Bar Graphs
Second graders create a bar graph to pictorically represent the data collected from a survey of students. They use Excel to electronically create the graphs and data tallies. They then interpret their data using sentences to explain.
Curated OER
Names Count!
Second graders work in small groups to complete a graph and use data to determine range, mode, and median. They use the number of letters in their names and in fairy tale characters names to produce their data. This is a fun lesson!
Curated OER
Graphing Pasta
Students sort and graph various types of pasta. Using pasta construction paper patterns or real pasta, they sort the pasta by color, size, and type, and record the data on a graph.
Curated OER
Science: Backyard Bugs Data Collection
Young scholars practice data collection skills by observing common bugs found in their local environment. Once the data is collected they complete data sheets to compare, contrast, sort, and classify the insects. The lesson plan...
Curated OER
Introduction to Lego Robotics
Learners utilize computer programs to operate a simple robot. In this technology lesson, students create robots using Lego pieces and simple motors to move them. Learners measure the speed of the robots by running Robolab software on...
Curated OER
Money
Students count money using only coins. In this money lesson, students read Bennies Pennies, practice counting the pennies in the story and are then introduces to the different coins, penny, nickel, dime and quarter. Students use...
Curated OER
Green Food Graph
Students explore graph making by investigating St. Patrick's day food. In this holiday food instructional activity, students discuss their favorite green foods in honor of St. Patrick's day. Students create a graph based on the data of...
Other popular searches
- Data Sets Data Collection
- Linear Data Sets
- Comparing Two Data Sets
- Quadratic Data Sets
- Data Sets and Graphs
- Compare Related Data Sets
- Experiments and Data Sets
- Correlation of Data Sets
- Create Data Sets
- Circle Graph Data Set
- Compare Data Sets
- Compare Two Sets of Data


