Curated OER
How Long? How Wide?
Second graders distinguish between and use nonstandard and standard units of measurement, use appropriate tools and techniques to measure length and width, and record and interpret data using graphs.
Curated OER
Graphing
Intended for a faith-based classroom, this lesson requires second graders to create a survey, conduct the survey in multiple classrooms, and graph the results. They can choose between creating a picture or bar graph, or you can require...
Curated OER
Can You Measure Up?
Here is a well-designed lesson on common standards of measurement for your young mathematicians. In it, learners calculate measurements in standard and non-standard units. They make predictions, record data, and construct and design...
Curated OER
Probability With a Random Drawing
Students define probability, and predict, record, and discuss outcomes from a random drawing, then identify most likely and least likely outcomes. They conduct a random drawing, record the data on a data chart, analyze the data, and...
Curated OER
Weather Report Chart
Students complete a weather report chart after studying weather patterns for a period of time. In this weather report lesson, students measure temperature, precipitation, cloud cover, wind speed, and wind direction for a month. Students...
Curated OER
Heads-Up Probability
Second graders use tree diagrams to predict the possible outcomes of coin tosses. The data they collect and graph also help them predict the likelihood of getting heads or tails when tossing coins the next time.
Curated OER
Graph Your Foot!
Students measure their own foot and place the outline on a graph. They make connections between the size of their foot and the bar graph that represents it.
Curated OER
Birthdays
Students collect data about the birth months of each classmate using a calendar. They make a table with the information before designing a pictograph using cupcake images. They answer questions using the graph.
Curated OER
A Bar of Many Colors
Second graders use colored candies to collect data, construct double bar graphs, and find averages.
Curated OER
Graphing Activity #3
In this graph learning exercise, students use information in a tally chart to complete a pictograph of favorite pizza toppings and answer 4 related questions. A website reference for additional resources is given.
Curated OER
When Ants Fly
Here is a great lesson on constructing line graphs. Learners identify common characteristics of birds, ants common needs of all living things. They also write a story from the perspective of an ant or a bird that has lost its home and...
Curated OER
Telling Time to 5 Minutes
In this second grade lesson your class will practice telling time. The goal is to tell time to five minutes using an analog clock. Your young students count by 5 minute intervals and discuss elapsed time.
Curated OER
Jack and the Beanstalk Math
Students listen to Jack and the Beanstalk and determine what they think are the most common words. In this Jack and the Beanstalk lesson, students reread the story, count the words they chosen and graph those words. Students graph the...
Curated OER
Drawing Bugs Game
Second graders explore probability by playing a drawing game with dice. After they roll a die, they draw a tree diagram to illustrate each of the possible outcomes.
Curated OER
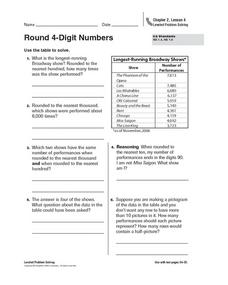
Round 4-Digit Numbers
In this rounding numbers practice worksheet, students sharpen their problem solving skills as they solve 6 story problems that require them to round 4-digit numbers.
Alabama Learning Exchange
The Grouchy Ladybug
Learners listen to the book, "The Grouchy Ladybug" by Eric Carle and sequence the events in the story. Using a graph, they draw and color the animals that the ladybug meets next to the corresponding time from the story, and conduct...
Curated OER
Tally Time
Students create a tally chart. In this math and health lesson, students discuss healthy foods and create a tally chart showing the number of students who like to eat healthy foods.
Curated OER
Leap Frog Experiment
Second graders ask questions and design an experiment to explore different spinners in "The Leap Frog" board game. They conduct their experiment, collect information and interpret the results using a graph.
Pennsylvania Department of Education
Up on Top
Students make bar graphs and identify items in the bar graphs as being likely, certain, or impossible. In this bar graphs lesson plan, students answer questions about the bar graphs using reasoning and communication skills.
Curated OER
Jelly Belly: What a Wonderful "Bean"!
Students explore how jelly beans are produced. They discuss the origins of the jelly bean and view a video about how jelly beans are prepared, tested, shaped, finished, and shipped and estimate the amount of jelly beans in a jar and sort...
Curated OER
Telling Time to 5 Minutes
Students take part in various activities ranging from creating a human clock, to small group problem solving to reinforce the concept of telling time accurately to five minutes on an analog clock.
Curated OER
It's a Fact!
Second graders investigate the concept of addition and subtraction while manipulating a variety of different resources. They focus upon the use of the games in order to keep student engagement. Then students are given the opportunity to...
Curated OER
SkittleGraphs
Second graders discover how to make a bar graph. Each student receives a bag of Skittles candy. They make a bar graph which documents the colors found in the bag. At the end of the lesson plan, the Skittles are eaten. Fun!


