Curated OER
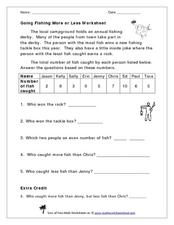
Going Fishing More or Less Worksheet
Take your class on a hypothetical fishing trip! This word problem gives a data set describing how many fish each of the nine contestants in a fishing derby caught. The numbers range from zero to ten. Learners examine the data and answer...
Curated OER
Sorting and Graphing Animals
Students inquire about animals using SIRS Discoverer or eLibrary Elementary. In this organizing data lesson, students sort pictures of animals in various ways and develop graphs. Students locate a mammal, reptile, fish, insect or bird...
Curated OER
What Do You Like To Do the Most After School?-- Class Bar Graph
In this math worksheet, students collaborate to make a class bar graph which will display data on favorite leisure time activities. Students survey their classmates and plot the results on the graph. Six choices are given: games, read,...
Curated OER
Going Graph-y
Second graders listen to and dicuss the story Where the Wild Things Are. They play a pantomime game and act out various feelings so their classmates can guess. They listen for the frequency of certain words, and record their findings on...
Kid Zone
Groundhog's Day Graphing
This Groundhog's Day, challenge scholars to predict, estimate, tally, and graph in a weather-themed lesson in which class members play the role of the groundhog to forecast the weather come February second.
Curated OER
Graphing in the Form of Bar Graphs
Students explore bar graphs. In this math lesson, students create and conduct a survey. Students graph their data in a bar graph.
Curated OER
Data Handling: Pictogram of Birds
In this pictograph problem solving learning exercise, students analyze a pictograph of birds seen each day for a week. They use the information on the graph to solve 6 problems.
Heidi Songs
Zoo Animal Probability Graph
Capture the engagement of your young mathematicians with a collaborative graphing activity. Using a deck of zoo animal picture cards, students select a picture from the deck, record the chosen animal on a graph, and then replace the card...
Curated OER
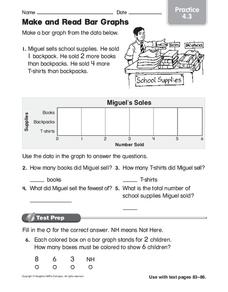
Make and Read Bar Graphs
In this bar graphs worksheet, students make a bar graph about the sale of school supplies with the data presented in one story problem.
Curated OER
How Many Brothers And Sisters Do You Have? -- Class Bar Graph
In this math worksheet, students collaborate in generating a class bar graph which displays information about how many brothers and sisters each classmate has. Data is plotted on a bar graph.
Curated OER
Numbers and Me
Students collect and graph data about themselves. In this collecting and graphing data instructional activity, students poll their classmates about how many siblings they have or they measure their height. Students make a bar graph of...
Curated OER
Our Favourite Halloween Treat
Students conduct a survey about Halloween candy and create a bar graph illustrating the data. In this data analysis lesson, stud nets are introduced to the topic with a discussion and survey, then the class creates a large graph and...
Curated OER
Populations and Life Cycles
Students explore biology by researching ocean statistics. In this data analysis lesson, students conduct a snail examination experiment utilizing live pouch snails. Students collect data about the snails over the course of six weeks and...
Curated OER
Applied Science - Science and Math Post-Lab
Students explore optical illusions. In this Applied Science activity, students view optical illusions and record the data of what they see. Students graph the data that they collect.
Math Drills
Valentine's Day Ordering and Comparing (A)
Youngsters use a data table to answer questions, in a Valentine's Day-themed worksheet.
Curated OER
Fast Food Survey Using Bar Graphs
Second graders create a bar graph to pictorically represent the data collected from a survey of students. They use Excel to electronically create the graphs and data tallies. They then interpret their data using sentences to explain.
Curated OER
What Sport Do You Like To Play the Most?== Class Bar Graph
In this math worksheet, students participate in making a group bar graph about their favorite sports. Students are surveyed and the responses plotted on a graph.
National Security Agency
Starting a Restaurant
Through an engaging unit, chefs-in-training will sort and classify data using tally charts. Learners will also create bar graphs to display restaurant data and interpret data from bar graphs using a variety of categories. This is a fun...
Curated OER
Hats for Sale
What type of hat do you think sells the best? Elementary learners will use the picture graph provided to answer the comprehension questions. A chart accompanies the picture graph, so youngsters can see the data multiple ways.
Curated OER
Favorite Days of the Week
In this bar graph worksheet, students use the blank graph to survey classmates and record their favorite day of the week. Students think of one question about the graph and write it on the line.
Curated OER
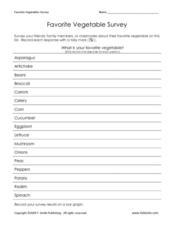
Favorite Vegetable Survey
What's your favorite? Use this chart template in your lesson on data collection and graphing. Learners record classmates' favorite vegetable in a survey, and then graph the results. A labelled graph is provided here- print both pages...
Curated OER
Graphing
Intended for a faith-based classroom, this lesson requires second graders to create a survey, conduct the survey in multiple classrooms, and graph the results. They can choose between creating a picture or bar graph, or you can require...
Curated OER
Best-Selling Books Bar Graph
Create a bar graph with your elementary school learners. First they read and interpret data, and then they color in the graph (provided) to indicate how many of each were sold. Consider providing them with the data but having them...
Other popular searches
- Graphing and Analyzing Data
- Graphing and Inputting Data
- Graphing Census Data
- Graphing Using Census Data
- Graphing and Data Entry
- Graphing Weather Data
- Graphing Population Data
- Graphing and Data
- Graphing Scientific Data
- Scientific Data and Graphing
- Science Data and Graphing
- Graphing Science Data


