Curated OER
Math Word Problems: Reading Bar Graphs
For this math word problems-reading bar graphs worksheet, students analyze the bar graph and answer six questions about the data in the graph.
Curated OER
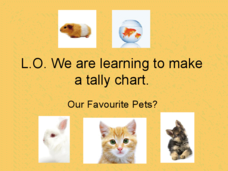
Pet Tally
Give the class an opportunity to practice using tally marks as a way to collect data. As you progress through the slide show, learners tally up the number and types of pets they see, they then use their data to create a tally chart....
Curated OER
Data Lesson Vital Information
Students prepare and collect data and use excel and create a graph. They collect data about the number of pattern blocks that are put on tables. Students then record that data in Excel.
Berkshire Museum
Camouflage!: Collecting Data and Concealing Color
Help young scholars see the important role camouflage plays in the survival of animals with a fun science lesson. Starting with an outdoor activity, children take on the role of hungry birds as they search for worms represented by...
Curated OER
Graphing Memories
Mem Fox’s Wilfrid Gordon McDonald Partridge provides the labels for a graphing activity. Class members create an illustration of a memory item brought from home, and place their illustration in the proper column of a graph. When the...
Worksheet Place
How I Get to School
Find out how many of your learners take the bus, how many walk, and how many bike with a quick survey. Class members gather data about how each individual gets to school and mark the results on this page in order to create a bar graph.
Los Angeles County Office of Education
Assessment for the California Mathematics Standards Grade 2
Test scholars mathematic skills with an assessment addressing addition, subtraction, multiplication, place value, measurement, geometric shapes, expanded notation; and their ability to compare numbers, write number sentences, draw...
K-5 Math Teaching Resources
Blank Bar Graph Template
This template is just begging for your young mathematicians to fill it in with colorful bar graphs! With horizontal and vertical axes in place and grid lines for added support, this is a great resource for teaching children how to...
World Wildlife Fund
Graphs and Charts
A two-part worksheet incorporating bar graphs and pie charts, young mathematicians can practice their graphing skills. Pupils answer questions using graphs and charts but are also challenged to create their own using a given set of data.
Curated OER
Color Tile Graphing
Students explore data. They gather data and generate questions about the data in pictographs, tallies, tables, and bar graphs. Students use color tiles pulled by random to create their own bar graph. They discuss the bar graphs they...
Curated OER
Graphing Trash Material
Students investigate data and recyclable materials. In this math lesson, students save recyclable materials and create a graph of the materials. Students discuss how they could help the environment by recycling.
Curated OER
Dynamite Data
Second graders rotate through a variety of stations designed to offer practice in manipulating data. They sort, tally and count items and then create bar graphs, tables, and pie graphs to record their findings.
Curated OER
Organizing And Reading Data
Learners complete three parts of an "Organizning and Reading Data" worksheet. First, they go over the rubric to determine the work will be scored. They organize data by taking tallies, make a pictograph and a bar graph using the data....
Curated OER
Pumpkin Seed Data!
Second graders work with pumpkins to estimate, then accumulate data about pumpkin seeds. After cleaning out the pumpkins, 2nd graders utilize a worksheet imbedded in this plan which has a variety of pumpkin math activities they can do.
Curated OER
Can You Count on Cans?
How can a canned food drive be connected to math? It's as simple as counting and organizing the cans! Children demonstrate their ability to sort non-perishable foods into categories that include soup cans, vegetable cans, boxed items,...
Curated OER
Graphing Toys!
Jason, Michelle, Sofia, and Willis all have a variety of toys. Use the chart provided to graph how many toys each child has. Who has the most toys? Who has the least? Help your learners study the graphs they create to better understand...
Curated OER
Bar Graphs and Data Analysis
In this graphing worksheet, students look at a bar graph of allowance and dollars. They answer 6 questions related to the bar graph.
Curated OER
Red Worms Rock!
Second graders measure red worms. In this lesson plan, 2nd graders observe and collect data on red worms. Students measure the red worms and create a graph with the data they collect.
Curated OER
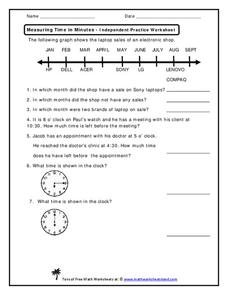
Measuring Time in Minutes
Time is measured in both months and minutes; scholars first examine a line graph to see in which months an electronic shop had sales on specific laptop brands. They answer three questions about the data. Then, they determine how much...
National Security Agency
Going Green with Graphs
In this unit designed for second graders, youngsters are introduced to conducting surveys and creating tally charts based on the data they gather. Students then construct bar graphs, and observe the relationships between the two types of...
Curated OER
A Day at the Beach
Let's go to the beach! Danielle, Marty, and Phil collected shells at the beach. Can you determine how many shells each child has? Create a picture graph to make the data easier to understand.
Curated OER
How Do You Like To Eat Your Apples?-- Class Bar Graph
In this math worksheet, students collaborate as a group to plot data pertaining to their favorite ways to eat apples: sliced, pie, whole, sauce, caramel or muffin. Students record their class data on the bar graph.
Curated OER
Learning to Read Graphs
What is your favorite pet? This is a great tool for youngsters just learning how to read and interpret graphs. There are four simple questions. Consider extending this activity by creating a class bar graph: how many learners have a dog,...
Curated OER
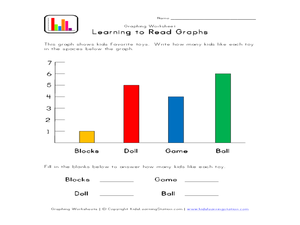
Learning to Read Graphs 2
Do you like playing with blocks, dolls, games, or balls? Use this basic graph to review bar graphs with young learners. After completing the four questions below, consider creating your own class graph: who likes blocks the best? Who...
Other popular searches
- Graphing and Analyzing Data
- Graphing and Inputting Data
- Graphing Census Data
- Graphing Using Census Data
- Graphing and Data Entry
- Graphing Weather Data
- Graphing Population Data
- Graphing and Data
- Graphing Scientific Data
- Scientific Data and Graphing
- Science Data and Graphing
- Graphing Science Data


