Curated OER
A Day at the Beach
Let's go to the beach! Danielle, Marty, and Phil collected shells at the beach. Can you determine how many shells each child has? Create a picture graph to make the data easier to understand.
Curated OER
Piles of Paper
Track how much paper their class uses in a week. They will pile their used paper into one place, each day the pile is measured. They make predictions about how much paper they would collect in a month, then recycle the paper.
Curated OER
Interpreting Data from Birdfeeders
What kinds of birds live in your area? Read a book about birds to your learners and explore their feeding patterns. Charts and graphs are provided in this three page packet, but consider assigning the basic questions if using with young...
Curated OER
Learning to Read Graphs
What is your favorite pet? This is a great tool for youngsters just learning how to read and interpret graphs. There are four simple questions. Consider extending this activity by creating a class bar graph: how many learners have a dog,...
Curated OER
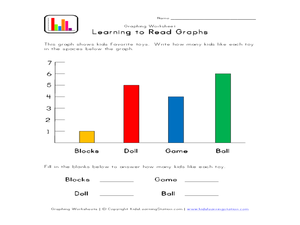
Learning to Read Graphs 2
Do you like playing with blocks, dolls, games, or balls? Use this basic graph to review bar graphs with young learners. After completing the four questions below, consider creating your own class graph: who likes blocks the best? Who...
Curated OER
One More/One Less Scoop
It's so simple: scoop a spoonful of counters, count them, and then make a set that is one more than that number. Next, make a set that is one less. The tangible nature of this basic addition and subtraction activity will keep learners...
Curated OER
Populations and Life Cycles
Students explore biology by researching ocean statistics. In this data analysis lesson, students conduct a snail examination experiment utilizing live pouch snails. Students collect data about the snails over the course of six weeks and...
Curated OER
Can You Measure Up?
Here is a well-designed lesson on common standards of measurement for your young mathematicians. In it, learners calculate measurements in standard and non-standard units. They make predictions, record data, and construct and design...
National Security Agency
Starting a Restaurant
Through an engaging unit, chefs-in-training will sort and classify data using tally charts. Learners will also create bar graphs to display restaurant data and interpret data from bar graphs using a variety of categories. This is a fun...
Curated OER
Graphs
For beginners to picture graphs this is the perfect resource. They analyze two bar graphs that break down data visually so scholars can actually count the number in each column. For the first, they fill in how many of each type of pet is...
Curated OER
Data Analysis and Probability Race to the Finish
Students practice addition facts, record data, and construct a bar graph. For this probability lesson, students participate in a board game in which bicycles move towards a finish line based on players completing addition problems. Dice...
Curated OER
Dynamite Data
Second graders rotate through a variety of stations designed to offer practice in manipulating data. They sort, tally and count items and then create bar graphs, tables, and pie graphs to record their findings.
Living Rainforest
Finding the Rainforests
From Brazil to Indonesia, young scientists investigate the geography and climate of the world's tropical rain forests with this collection of worksheets.
Los Angeles County Office of Education
Assessment for the California Mathematics Standards Grade 2
Test scholars mathematic skills with an assessment addressing addition, subtraction, multiplication, place value, measurement, geometric shapes, expanded notation; and their ability to compare numbers, write number sentences, draw...
PBS
Curious George: Graphing
After watching an engaging video where Curious George gets to play librarian for the day, sorting books, scholars sort information and graph their data. Learners move from concrete to picture to abstract graphing and analyze class...
K-5 Math Teaching Resources
Blank Bar Graph Template
This template is just begging for your young mathematicians to fill it in with colorful bar graphs! With horizontal and vertical axes in place and grid lines for added support, this is a great resource for teaching children how to...
Curated OER
Bouncy Ball Collections
In this data table worksheet, students examine a table regarding bouncy ball data and respond to 4 questions regarding the data.
Pennsylvania Department of Education
Adding and Subtracting Three-Digit Numbers by Jumping
Second graders use data to graph information and draw conclusions. In this lesson on data analysis, 2nd graders practice gathering, sorting, comparing, and graphing data. Students differentiate data that can and cannot change over time.
Curated OER
Pumpkin Seed Data!
Second graders work with pumpkins to estimate, then accumulate data about pumpkin seeds. After cleaning out the pumpkins, 2nd graders utilize a worksheet imbedded in this plan which has a variety of pumpkin math activities they can do.
Curated OER
Countdown to Disaster
Students discover the potential dangers of weather in their hometown. In this environmental lesson, students research Hurricane Hugo and the devastation it caused South Carolina in 1989. Students record weather data from their city and...
Curated OER
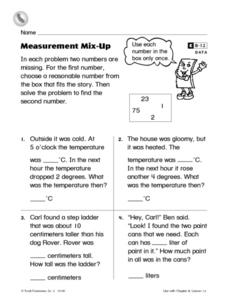
Measurement Mix-Up
In this measurement worksheet, 2nd graders read 4 word problems and find the two numbers missing in each one. Students choose a reasonable number from the box that fits the story for the first number and then solve the problem to find...
Curated OER
Graphing with the Five Senses
Students collect data and record it on a bar graph. In this data graphing lesson, each small group of students is assigned to collect data on one of the five senses. They then practice a song that helps them remember the purpose of each...
Curated OER
Survey and Share
Young scholars practice collecting data by surveying other students. In this data collection lesson plan, young scholars decide on a question and collects data from 15 other students. Eventually the young scholars will end up graphing...
Pennsylvania Department of Education
Eye to Eye
Students practice the concept of posing mathematical questions regarding themselves and their surroundings. For this eye to eye lesson, students gather data about eye color from their classmates. Students organize their data in order to...
Other popular searches
- Collecting and Recording Data
- Collecting and Organizing Data
- Collecting and Graphing Data
- Collecting and Using Data
- Games on Data Collecting
- Collecting Weather Data
- Collecting and Comparing Data
- Patterns Data Collecting
- Math Data Collecting
- Patterns, Data Collecting
- Collecting and Charting Data
- Patterns\, Data Collecting


