Curated OER
Graphing Favorite Holidays
Students create spreadsheets and bar graphs based on results of survey of favorite holidays.
Curated OER
Connecting With Coordinates
Play a coordinates game to encourage collaborative learning and grid use! Learners plot points on grids and play a game that challenges them to locate a specific point on a coordinate grid by using horizontal and vertical movements.
Curated OER
Veggie Chop and Data Analysis
First graders chop vegetables into fractions. In this fractions lesson, 1st graders cut vegetables, collect data about favorite vegetables and create a bar graph using the information. Students make inferences about the data and record...
Math Drills
Valentine's Day Ordering and Comparing (B)
Discover this Valentine's Day-themed learning exercise where young mathematicians answer word problems using data tables.
Math Drills
Valentine's Day Ordering and Comparing (A)
Youngsters use a data table to answer questions, in a Valentine's Day-themed worksheet.
Curated OER
Graphing Our Favorite Candy Bars
Students use ClarisWorks to graph class' favorite candy bars on a bar graph.
Curated OER
M & M Math
Learners sort M & Ms by a given attribute, and estimate how many M & Ms are in two bags. They graph their M & Ms and conclude which color they have the most and least of, then students combine sets of M & Ms together and...
T. Smith Publishing
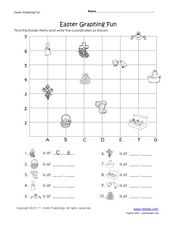
Easter Graphing Worksheet
A large graph takes up most of this instructional activity. On it are Easter-themed icons for which learners must identify and write down the coordinates for. Note that there are religious symbols included in the icons which would not...
Curated OER
Reading the Neighborhood
First graders complete activities with the story One Monday Morning in the Macmillan/McGraw Hill Textbook. In this data lesson, 1st graders read the story and gather data to create a picture graph. They read the graph and answer...
Curated OER
How Do You Like Your Eggs?
First graders conduct a poll about how people like their eggs. In this graphing lesson, 1st graders collect data about how they like their eggs. Students use a picture of themselves to place under the type of egg they like. Students then...
Curated OER
Rooster's Off To See the World Number-Sense
Students recognize how numbers are used in number stories. In this Rooster's Off To See the World lesson, students participate in the story. Students complete a number activity and work on the computer to illustrate a number story. ...
Curated OER
M&M Graphing and Probability
Students create a variety of graphs. They count, sort, and classify M&M's by color and record data on a chart. They use data from the chart to create pictographs, bar graphs and circle graphs. They analyze data and determine...
Curated OER
Graphing with the Five Senses
Students collect data and record it on a bar graph. In this data graphing lesson, each small group of students is assigned to collect data on one of the five senses. They then practice a song that helps them remember the purpose of each...
Curated OER
Bananas! Bubble Gum! Which One?
Students design and create a graph of data they have collected on their favorite candy bars. They explore how to organize data as well.
Curated OER
Girl Scout Cookies Graph
Students graph which girl scout cookies they like the best. They create a Venn Diagram about which one is their favorite. They place cookie shaped cutouts on the correct spot on the graph.
Curated OER
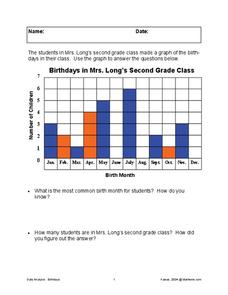
Birthday Graph
In this graphing worksheet, students interpret a graph of "birthdays in Mrs. Long's second grade class" to answer 2 related questions.
Curated OER
Data Lesson Vital Information
Pupils prepare and collect data and use excel and create a graph. They collect data about the number of pattern blocks that are put on tables. Students then record that data in Excel.
Curated OER
An Easier Way to Count: Using Groups of 10
Students explore their counting skills. In this counting lesson plan, students group objects in sets of 10 to practice counting them. Students also practice graphing the sets of objects they count. This lesson plan incorporates the use...
Curated OER
The Statistics of M&Ms
Young scholars explore the topic of statistics with M and Ms. In this math lesson plan, students use candy pieces to sort and gather information needed to create a bar graph. This instructional activity can be adapted to accommodate...
Curated OER
Valentine Candy Count
Students analyze a bag of Valentine candy to create a graph. In this graphing lesson, students make predictions, sort by color, record data and make a graph. Students discuss results and make generalizations. Students generate their own...
Curated OER
Recording Frequency
First graders analyze nursery rhymes and gather data about word frequency. In this frequency instructional activity, 1st graders create graphs and tables. Students interpret the data.
Education.com
Measure School Supplies
Ever wonder how long a pair of scissors are? Find out with this simple measuring activity in which pupils use the provided ruler to determine the length of four common classroom supplies.
Curated OER
Tally Time
Students create a tally chart. In this math and health lesson, students discuss healthy foods and create a tally chart showing the number of students who like to eat healthy foods.
Curated OER
Technology Literacy Challenge Grant Learning Unit
First graders explore counting and classification. They sort leaves, create graphs, write sentences for the data in the graphs, develop graphs for shapes, favorite animals, birthdays, and participate in a die prediction game.


