Curated OER
Snack Attack
Learners design charts, tables, graphs, and pictographs to analyse the types of snacks in a bag.
Curated OER
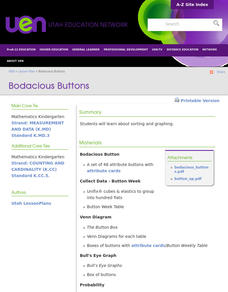
Bodacious Buttons
First graders participate in games, graphing, and probability exercises to sort and graph buttons. They sort buttons with Venn diagrams and Bull's Eye graphs.
Curated OER
Jelly Bean's Galore
Students investigate the origins of the Jelly Bean. They complete a Scavenger Hunt using the jellybean website. Pupils create a bar graph using information collected about jelly beans. Students discuss the time of year that Jelly Beans...
Curated OER
Popcorn Geography
Students use kernels to create a "Top Corn-Producing States" map or graph. They read and round off numbers. Students identify on a U.S. outline map the location of corn-growing states. They create a visual (map or graph) illustration...
Curated OER
Fire Safety Survey
Students collect data regarding fire safety and create a graph. Working in small groups, they administer a survey to family and friends regarding their attitudes toward fire safety. After data has been gathered, students graph their...
Curated OER
Yummy Apples!
Students discuss apples and how they are grown. They listen as the teacher reads "Apples," by Gail Gibbons. Students discuss the story. They view several different types of apples and compare their characteristics. Students taste several...
Curated OER
Bobby Banana's Garden
In this Bobby Banana's garden worksheet, students count how many fruits Bobby has picked from his garden and color the graph to show how many of each fruit Bobby picked.
Curated OER
Coordinates
In this coordinates instructional activity, students analyze two maps and identify the coordinates of ten specific locations. Students plot sixteen points on a graph and check their answers online at the end of each exercise.
Curated OER
Our Favourite Halloween Treat
Students conduct a survey about Halloween candy and create a bar graph illustrating the data. In this data analysis lesson, stud nets are introduced to the topic with a discussion and survey, then the class creates a large graph and...
Curated OER
How Many People Live in Your Household?
Students create a pictograph showing household size for the class.In this data collection and graphing lesson, the teacher guides students through the creation of a concrete object graph, then students analyze and summarize the results.
Curated OER
Count On It!
Students investigate money. In this consumer math lesson, students use coins, identify their value, then group them in various ways to equal a dollar.
Alabama Learning Exchange
Keep It Movin'!
Learners conduct an experiment to study friction. They complete a KWL chart on friction and conduct an activity about the amount of friction on a moving object. To conclude, pupils create a table or graph of the data collected and they...
Curated OER
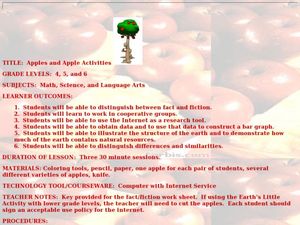
Apples and Apple Activities
Students investigate apples. In this reading comprehension instructional activity, students read a book about apples then compare and contrast, make graphs, distinguish between fact and fiction and work in groups. Students work in groups...
Curated OER
Lesson 3: Seven Day Road Trip
Students plan a seven day road trip. For this travel lesson, students plan a driving trip that includes five major cities or attractions in Florida or another state of their choice. They show the trip on a map, calculate distances that...
Curated OER
Understanding Presidential History
Students research to find the qualifications necessary to be President of the U.S. In this presidential qualification instructional activity, students research their family roots to see if they could qualify to be President. Students...
Curated OER
Aboriginal Statistics
Fourth graders analyze statistics of Native Americans by creating graphs. In this data analysis lesson, 4th graders define different statistical terms and practice finding those statistics from groups of numerical information about...
Curated OER
Buzzy, Buzzy Bee
Students simulate honeybees pollinating flowers. In this pollination lesson, students role-play the process of pollination over the course of several seasons. Students graph results and share their graphs with the class.
Curated OER
Coin Count & Classification
Students make a prediction about how 100 pennies sort by decade or year and then test their predictions. They organize their data using a graph that is imbedded in this lesson.
Curated OER
Common Sense Cookie Shop
First graders shop for a bag of cookies using toy money. In teams, they choose which variety to buy and decides which bills and coins are necessary to buy the bag of cookies and a cashier makes change. They tally the cookies purchased...
Curated OER
Coordinate Crunch
Students identify plots on a graph while playing a game on a large coordinate grid and then on smaller grids.
Curated OER
Frog and Toad are Friends
Students view a 30-minute video lesson to discover information about the characteristics of frogs and toads. They then transform themselves into frogs and participate in a Jumping Frog Jubilee. They work in groups of three to measure and...
Curated OER
A Class Census
Students recognize that data represents specific pieces of information about real-world activities, such as the census. In this census lesson, students take a class and school-wide census and construct tally charts and bar graphs to...
Curated OER
For The Birds
Student make bird feeders and describe feeding behaviors. In this bird feeder lesson plan, students construct simple bird feeders. They then put them outside and observe the feeding behaviors of birds. Then they graph the number of birds...
Curated OER
Polluting the Environment
Fourth graders construct mini-ecosystem, pollute the ecosystem, observe, collect, and record data on the effects of these pollutants on their ecosystem, organize data on spreadsheets, create graphs, and design presentations to share with...
Other popular searches
- Charts and Graphs Math
- Hidden Picture Math Graphs
- Misleading Graphs Math
- Powerpoint Math Graphs
- 1st Grade Math Graphs
- Math Graphs 4th Grade
- Math Reading Graphs
- Animals Math Graphs
- Math Graphs Grade 1
- Creating Math Graphs
- Math Graphs Using M&ms
- Math Interpreting Graphs


