Hi, what do you want to do?
Curated OER
Range and Measures of Central Tendency
Third graders take notes on a PowerPoint presentation featuring calculating and analyzing data. They practice skills highlighted in the presentation and create a table in Microsoft Excel showing data analysis.
Curated OER
Smallest to Tallest - Where is the Middle?
Third graders measure each other's height and find the mean, median, and mode for the height of students in their class. They line up tallest to shortest and discuss the most appropriate measure of central tendency for the class.
Curated OER
High School Mathematics Problems from Alaska: Fire Fighting Crew
Students apply mean, median and mode calculations of firefighter test scores to decide on hiring.
Curated OER
Mind Your Business
Learners explore how to identify the range, median, and mode in a list of numbers by using concrete materials.
Curated OER
Probability: the Study of Chance
Students experiment to determine if a game is fair, collect data, interpret data, display data, and state and apply the rule for probability. Students use a simple game for this experiment.
Curated OER
The One in the Middle
Young scholars review and reinforce the concepts of mean, median, and mode based on the number of siblings the students have. They use Post-it notes to organize and re-organize the data.
Curated OER
Slopes, Hopes, & Speed
Pupils investigate the sport of skiing through Internet research in this multi-task lesson. They compare and generalize the results of five individuals by using mean, median, and mode.
Curated OER
Introduction to Descriptive Statistics
Young scholars follow examples to study basic concepts of statistics. They work independently through the activities.
Curated OER
Outer Space and Cyber Space
Fourth graders learn about the Solar System while they use mean, median and mode to explore the characteristics of the planets. Students web publish expository writing.
Curated OER
Calculating Range for a Constant Velocity
Students read an explanation from the NASA Web-based "textbook", The Beginner's Guide to Aerodynamics, then use the information in combination with data from other Web sites to solve single variable equations for distance (range), time,...
Curated OER
The Bigger they Are . . .
Students do a variety of data analyses of real-life basketball statistics from the NBA. They chart and graph rebounding, scoring, shot blocking and steals data which are gathered from the newspaper sports section.
Curated OER
Stem-and-Leaf Plots
Students are introduced to stem-and-leaf plots and calculating the mean, median, and mode from the plots.
Shodor Education Foundation
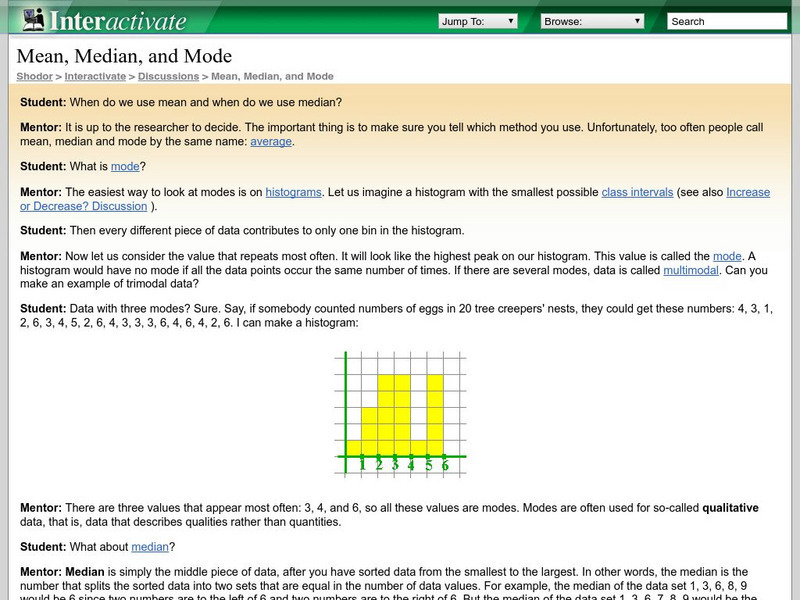
Shodor Interactivate: Mean, Median, and Mode Discussion
This is a virtual discussion between a mentor and student involving mean, median, and mode. Discusses when each is used and how they are found.
PBS
Pbs Learning Media: Restocking Shoes
In this video from Cyberchase, Bianca uses data on past shoe sales to help her decide what quantities of each size she should order in the next shipment.
Texas A&M University
Wtamu Virtual Math Lab: Beginning Algebra
This tutorial for students new to algebra provides explanations, definitions, examples, and practice problems. The practice tests cover topics such as real numbers, fractions, equations, graphing, and exponents.
Missouri State University
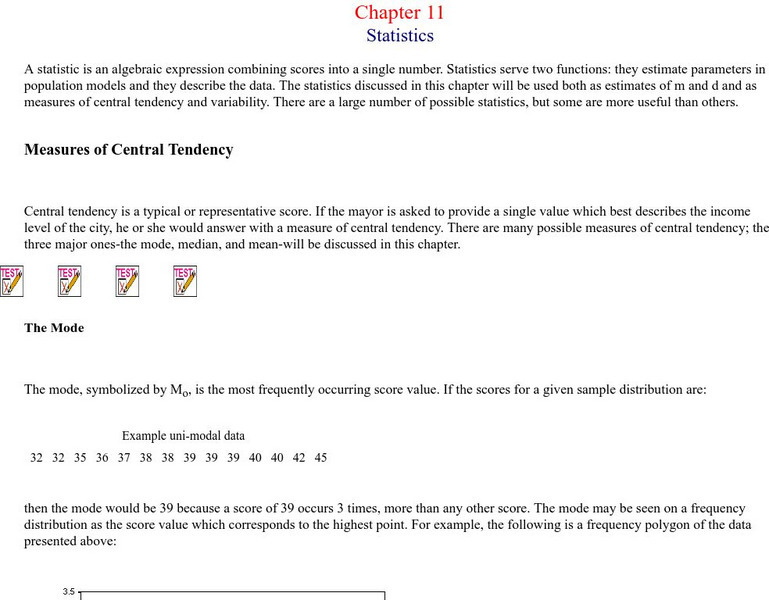
Missouri State University: Introductory Statistics: Statistics
This is an excellent resource on what the science of statistics involves. There are all kinds of definitions, examples, graphs, and charts to learn from. The topics covered include: mode, mean, median, skewed distributions and measures...
Houghton Mifflin Harcourt
Holt, Rinehart and Winston: Homework Help Independent Practice: Measures of Central Tendency
Get independent practice working with the mean, median and mode. Each incorrect response gets a text box explanation and another try. Correct responses are confirmed.
City University of New York
Measures of Variability
Explanation and examples of variance and standard deviation. Helpful charts and formulas are provided.
Texas Instruments
Texas Instruments: Numb3 Rs: Harmonizing Means
Based off of the hit television show NUMB3RS, this lesson exposes students to a different type of average, the harmonic mean. Although it is briefly reviewed in the lesson, students are expected to already be familiar with arithmetic and...
Texas Instruments
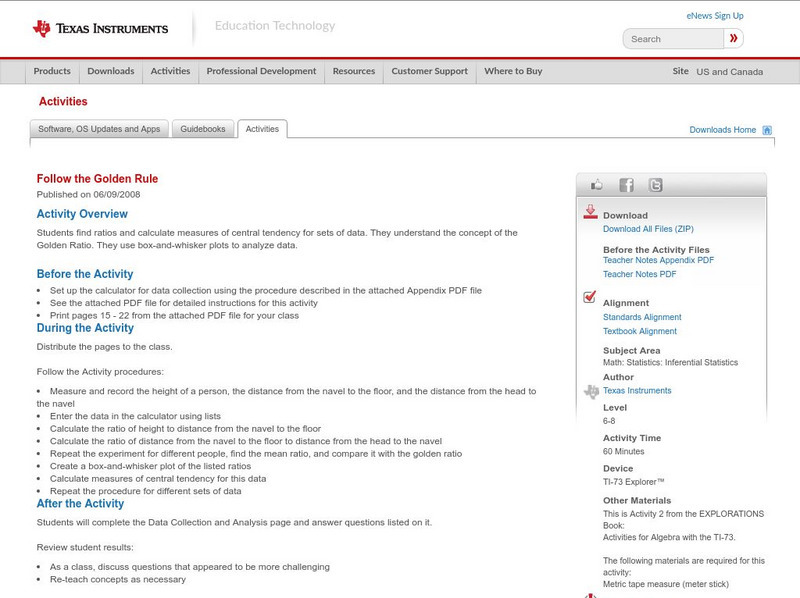
Texas Instruments: Follow the Golden Rule
Students find ratios and calculate measures of central tendency for sets of data. They understand the concept of the Golden Ratio. They use box-and-whisker plots to analyze data.
Texas Instruments
Texas Instruments: Celebrity Plots
Students can use celebrity ages to find central tendency and create scatter plots.
Stefan Warner and Steven R. Costenoble
Finite Mathematics & Applied Calculus: Measures of Central Tendency
Students learn about measures of central tendency. Topics explored are mean, median, mode, and expected value. The tutorial investigates the statistics concepts through class notes and examples. Review exercises and a chapter quiz are...
Rice University
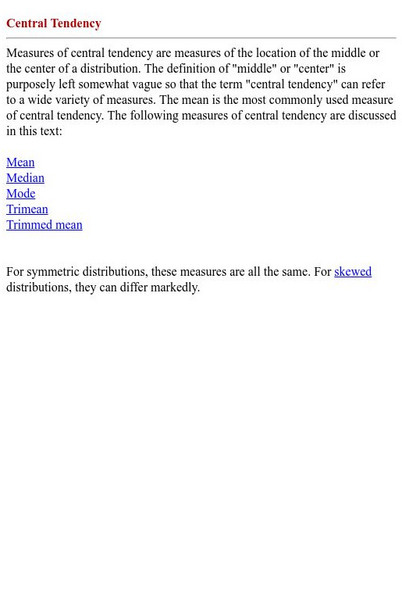
Hyper Stat Online Statistics Textbook: Central Tendency
Click on mean, median, mode, trimean, or trimmed mean to review central tendency.


