US Geological Survey
U.s. Geological Survey: Rain
At this site from the U.S. Geological Survey you can find out what makes rain such a valuable resource. Included is a chart that tells how much rain different cities in the United States receive. Click Home to access the site in Spanish.
NOAA
Noaa: National Severe Storms Lab: Thunderstorm Climatology
This page provides information on climatology in relation to severe thunderstorms.
The Franklin Institute
Franklin Institute Online: Make Your Own Barometer
At this site from the Franklin Institute Online, you are given instructions how to make a simple barometer as part of an activity in which you make a weather station for observation.
American Museum of Natural History
American Museum of Natural History: Resources for Learning: The Path to El Nino
Through this resource, students explore the history, causes, effects, and patterns of El Nino.
USA Today
Usa Today: Jet Stream Roars Along High Above Earth
A good explanation of the jet stream is offered with links to other related information.
Center of Science and Industry
Cosi Columbus: Clues About Clouds
Science experiment that simulates how clouds are formed. Includes full list of materials, procedures, and scientific explanation of what must happen in the atmosphere for cloud formation to occur.
Other
Cornerstone Networks: Fourth Grade Science Lesson 1
This site, designed as a fourth-grade lesson, focuses on the earth's atmosphere with information on prevailing winds.
Scholastic
Scholastic: Study Jams! Science: Weather & Climate
A video and a short multiple-choice quiz on the topic of weather and climate, and the difference between them.
Scholastic
Scholastic: Study Jams! Science: Weather & Climate: Clouds and Precipitation
A slideshow and a short multiple-choice quiz on the topic of clouds, how they form, the kinds of precipitation they can create, the main types of clouds, and cloud descriptor terms.
Writing Fix
Writing Fix: The Who/what/where/when Game: Wild Weather Sentences
In this lesson plan, Teaching Grammar in Context by Constance Weaver provides foundational information for this lesson plan. Brave Irene, written by William Steig, is used as the mentor text of this lesson plan. Students will develop...
Microsoft
Microsoft Education Lesson Plan: Making Money From Lemons
Simulation where learners apply mathematics and economics concepts in the lemonade business. Learners set up a virtual lemonade stand and must determine production costs, product variables, and profits. Students record data collected on...
Scholastic
Scholastic: Study Jams! Science: Weather & Climate: Severe Storms
A slideshow and a short multiple-choice quiz on the topic of severe storms, some types, and the damage that they cause.
University Corporation for Atmospheric Research
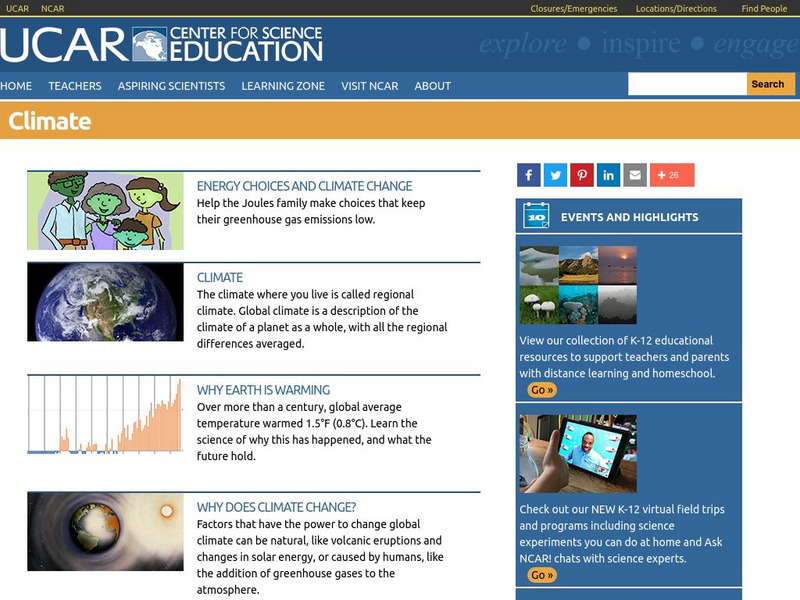
Ucar: Introduction to Climate
A detailed overview of the Earth's climate, with explanations about the difference between weather and climate, dendrochronology, palynology, and how Earth's climate has changed over time. All information is reinforced through pictures,...
Other
Weather Pages: Thunderstorm Map
This site contains a map of the Average Annual Days of Thunderstorms in the US. Cities are ranked in a table according to their average annual thunderstorm. Look for your city!
National Geographic
National Geographic: Educator Resources: Extreme Weather on Other Planets
Find lesson plans, worksheets, photo galleries, and related links for teaching about the weather systems of planets in our solar system.
National Geographic
National Geographic: Climate
An encyclopedia entry defining and giving examples of climates. Learn how a climate is related to its weather. Entry contains both pictures and vocabulary.
National Geographic
National Geographic: Extreme Weather on Our Planet
This lesson from National Geographic for grades 2-5 has a great photo gallery and video of extreme weather, and a chart for plotting weather investigation. Learning objectives, teaching methods, and connections to National Science...
National Geographic
National Geographic: Build a Magnetometer
Hands-on project where the learner constructs a magnetometer to monitor and measure changes in earth's magnetic field. These changes can then be used to track solar storms.
NASA
Nasa: Astronomy Picture of the Day: Jupiter From Voyager
Taken by Voyager 1 as it passed Jupiter in 1979, this image shows the Great Red Spot, which is a hurricane-like storm that has lasted over 300 years, and is more than three times the size of planet Earth.
NASA
Nasa: Astronomy Picture of the Day: Jupiter's Great Red Spot
This collage of images by the Hubble Space Telescope captured the changes in Jupiter's Great Red Spot over a period of several years.
Geography 4 kids
Geography4 kids.com: But Is It Weather?
Discover the significance of studying weather as well as climate with this resource and the videos it presents from NASA.
E-learning for Kids
E Learning for Kids: Science: Antarctica Research Center: Describe Different Weather Patterns
This module provides informational text about weather. Students will learn about precipitation and storm fronts. Students will also learn about different types of storms, including the following: hurricanes, cyclones, and typhoons.
Other
Gpb: Talking Up a Storm
Learn about the tools meteorologist use to predict changes in the weather patterns. Understand how these tools help them give us an accurate forecast.


