Curated OER
How to Buy a Computer
Students investigate the purchase of a specific computer hardware with specific components without going over a budget. The use of computer catalogues, tables, and spreadsheets support the search.
Curated OER
Technical Literacy
Pupils explore the components of the transference of technological information through this ten lesson unit. The applications to specific careers, the determination of responsible use of technology, and the affects of technology on life...
Curated OER
Seaside Science
Students classify sea life and shells and develop computer-generated tables and graphs. They observe a desalinization demonstration and enter information on their laptops through each step of the scientific experimental process.
Curated OER
Creating Graphs from Tables
Students interpret data from tables and then create a graph to show the same data in a different organization.
Curated OER
Organizing Data Using Tables and Graphs
Students create graphs and tables, as well as interpret and make inferences from the data shown to determine when and where graphs and tables are most useful.
Curated OER
Table Interpretation
Students solve problems using graphs to list and interpret data. Each student construct his or her own graph using art paper and markers. They be given a set of information to apply to their graphs and interpret their findings.
Curated OER
Dynamite Data
Second graders rotate through a variety of stations designed to offer practice in manipulating data. They sort, tally and count items and then create bar graphs, tables, and pie graphs to record their findings.
Curated OER
Nine Examples for Tables, Pictographs, Mean. Median, and Mode
In this graphical representation of data and measures of central tendency worksheet, students calculate mean, median, and mode and answer questions related to graphs, tables, and pictographs.
Curated OER
The Largest Volcano on Earth
Pupils create time-lines of tow major eruptions and use this information to determine what happens during an eruption. In this volcano lesson students read information about previous eruptions and create a time line.
Curated OER
Potential Energy
Students examine the concept of potential energy and see that it is the ability to do work. In this energy instructional activity students complete several activities on potential energy.
Curated OER
Count and Add Tables
In this number sentence worksheet, students complete a number sentence about adding tables together. Students complete 1 number sentence.
Curated OER
Function Tables
In this graphing worksheet, students complete two different word problems by filling out the function tables and then writing an algebraic equation for the problems.
Curated OER
Speaking and Listening
In this basic mathematics worksheet, students follow instructions as given to play a math game. They listen for detail in explanations and narratives in various contexts. Students also provide feedback and confirmation of what they...
Curated OER
Thinking Systematically
Sixth graders solve real life mathematics problems. After reading a given problem, 6th graders gather and organize data into a table. They explore a pattern, and from this, derive a formula. Students solve the problems multiple ways...
Curated OER
Making A Table
Sixth graders explore creating tables as a way to organize data. Students read story problems and discuss methods and strategies to solve them. They practice drawing tables, spotting patterns, and identifying missing information.
Curated OER
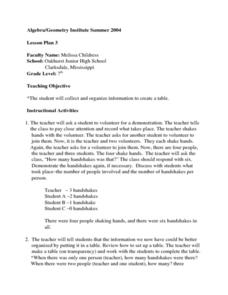
Creating a Data Table
Seventh graders explore organizing data into a table. The teacher leads a handshaking activity among the class. They collect the information concerning the number of handshakes each person received. Students discover a pattern. They...
Curated OER
Finding Rates
Fifth graders explore the concept of rates and how to solve them in problems. They solve the problems using multiplication. The majority of the instructional activity is direct instruction with the students being included in the process.
Curated OER
Jo's Table
Second graders work on the problem with a partner. They examine what they are supposed to be doing. They share the students's solutions making sure than they are looking for patterns along the diagonals.
Curated OER
Preformatted Text
Students examine how to create a table of aligned text. They apply tabs and spaces to control the placement of text on a page.
Curated OER
Using an Amortization Table
Students search the Internet to find a site that contains an amortization table and make a hypothesis about the results of changing time and rate. They examine the affects of time and rate on a mortgage and discuss the difference in the...
Curated OER
Charting Weight
Sixth graders record the weight of themselves and 3 family over a week, and then use that data to compile 2 bar graphs and 4 line graphs and answer a series of questions.
Curated OER
Surveying During a Basketball Game
Tenth graders conduct a survey at a high school basketball game. They compile and present the data as histograms or bar graphs.
Curated OER
Building Data
Students collect census data to help them determine where to build a new supply superstore.
Curated OER
You Are What You Eat (High School)
Students evaluate data from a statistical chart or graph which they find in a newspaper or magazine.


