Hi, what do you want to do?
University of Texas
Inside Mathematics: Granny's Balloon Trip [Pdf]
This task challenges a student to use knowledge of scale to organize and represent data from a table on a graph.
University of Colorado
University of Colorado: Ph Et Interactive Simulations: Equation Grapher
An interactive simulation that teaches about graphing, polynomials, and curves by adjusting the constants to observe the effect on the shape of the curve. This simulation can either be downloaded or played online and includes handouts,...
Harvard University
Harvard Smithsonian: Everyday Classroom Tools
The focus of this series of lessons is to engage students in an exploration of the world around them. The emphasis is on inquiry as students learn about the earth, sun, light, shapes and more.
University of Saskatchewan (Canada)
University of Saskatchewan: Algebra 2 Review
A more advanced review of Algebra II concepts allows students to test their readiness for higher level math courses. Topics range from absolute value to rational expressions.
NASA
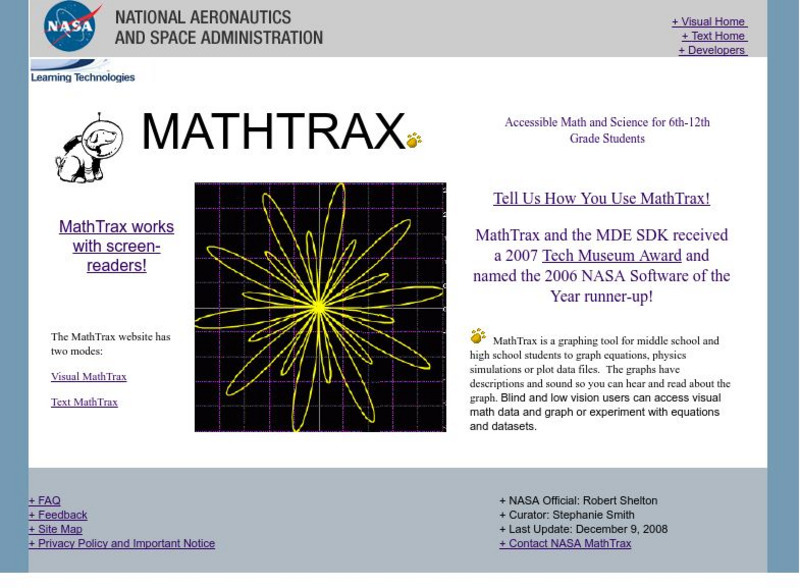
Nasa: Mathtrax Graphing Tool
NASA: Mathtrax is a graphing tool where the graphs includes descriptions and sounds. It is also adaptable for students who have visual accomidations.
Annenberg Foundation
Annenberg Learner: Journey North: Gray Whale Migration Study
Follow gray whales as they make their long journey from Mexico to their feeding grounds in the Arctic. This webpage gives students background information and up to date news about the migration of the gray whales. Also, students can...
Buck Institute
Buck Institution for Education: Pblu: What Will They Think?
Graphing and making predictions go hand in hand during this real-world example of project-based learning.
TeachEngineering
Teach Engineering: Flood Analysis
Students learn how to use and graph real-world stream gage data to create hydrographs and calculate flood frequency statistics. They also learn how hydrographs help engineers make decisions and recommendations to community stakeholders...
TeachEngineering
Teach Engineering: A Place in Space
The students will use a "real" 3D coordinate system. They will have 3 axes at right angles, and a plane (the XY plane) that will be able to slide up and down the Z axis. The students will then be given several coordinates and asked to...
TeachEngineering
Teach Engineering: Biomimicry: Echolocation in Robotics
Students use ultrasonic sensors and LEGO MINDSTORMS NXT robots to emulate how bats use echolocation to detect obstacles. They measure the robot's reaction times as it senses objects at two distances and with different sensor threshold...
TeachEngineering
Teach Engineering: A Lego Introduction to Graphing
Students use a LEGO ball shooter to demonstrate and analyze the motion of a projectile through use of a line graph. This activity involves using a method of data organization and trend observation with respect to dynamic experimentation...
TeachEngineering
Teach Engineering: Graphing the Spread of Disease
Students simulate disease transmission by collecting data based on their proximity to other students. One option for measuring proximity is by having Bluetooth devices "discover" each other. After data is collected, students apply graph...
TeachEngineering
Teach Engineering: Who Can Make the Best Coordinate System?
Students learn about coordinate systems in general by considering questions concerning what it is that the systems are expected do, and who decided how they look. They attempt to make their own coordinate systems using a common area...
TeachEngineering
Teach Engineering: At the Doctor's
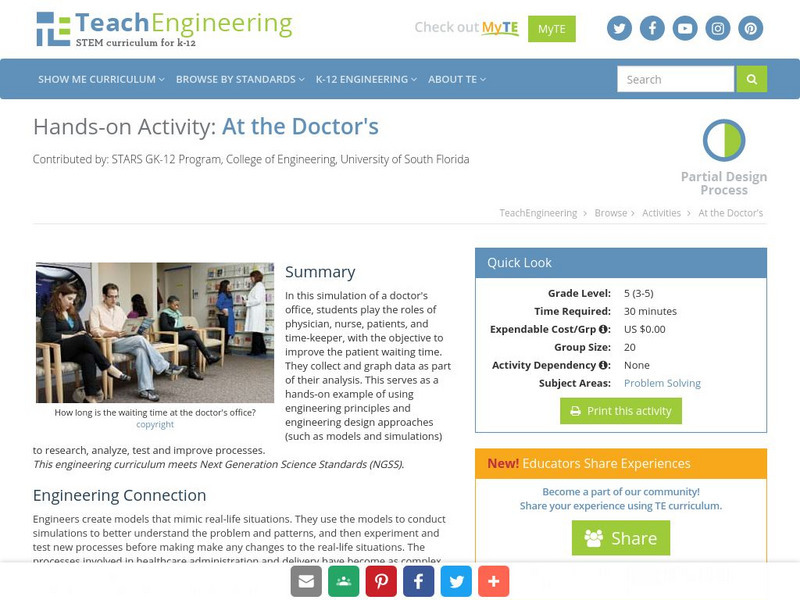
In this simulation of a doctor's office, students play the roles of physician, nurse, patients, and time-keeper, with the objective to improve the patient waiting time. They collect and graph data as part of their analysis. This serves...
TeachEngineering
Teach Engineering: Matching the Motion
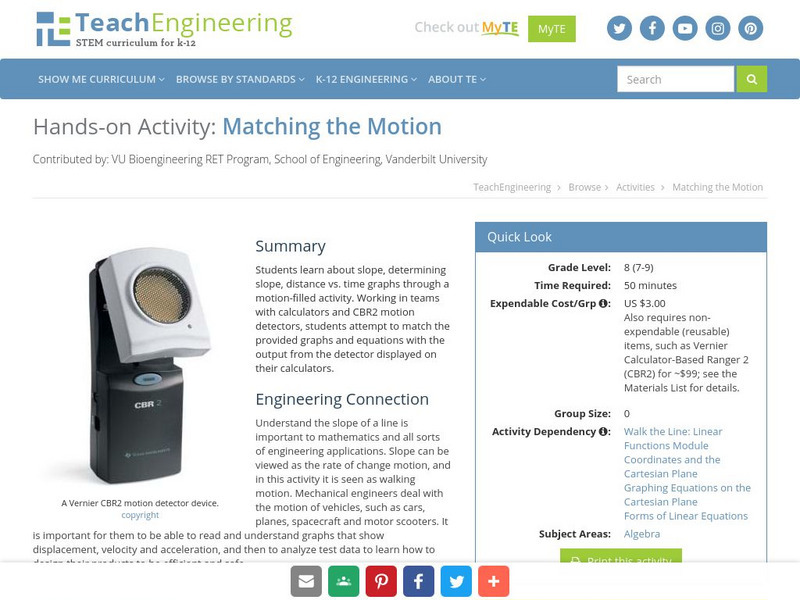
Students learn about slope, determining slope, distance vs. time graphs through a motion-filled activity. Working in teams with calculators and CBL motion detectors, students attempt to match the provided graphs and equations with the...
TeachEngineering
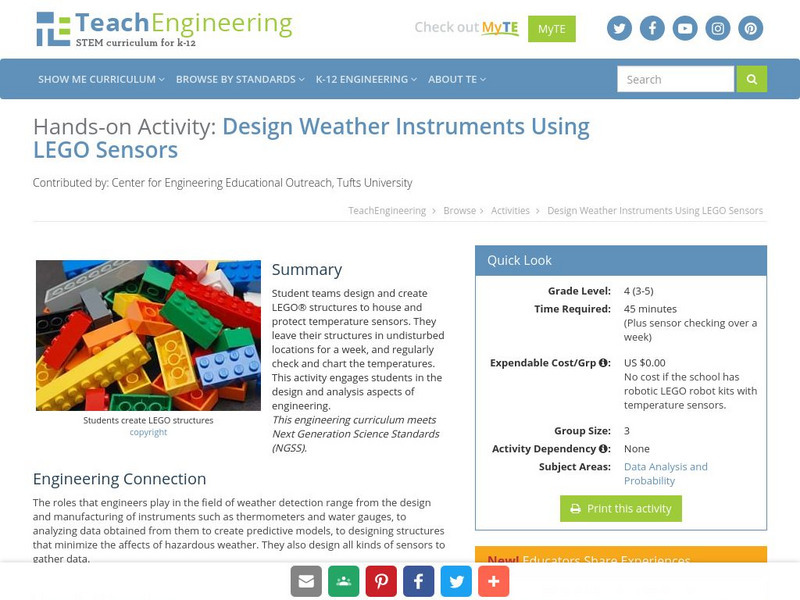
Teach Engineering: Design Weather Instruments Using Lego Sensors
Students will design and create a LEGO structure that will house and protect a temperature sensor. They will leave the structure in a safe spot and check the temperature regularly and chart it.
TeachEngineering
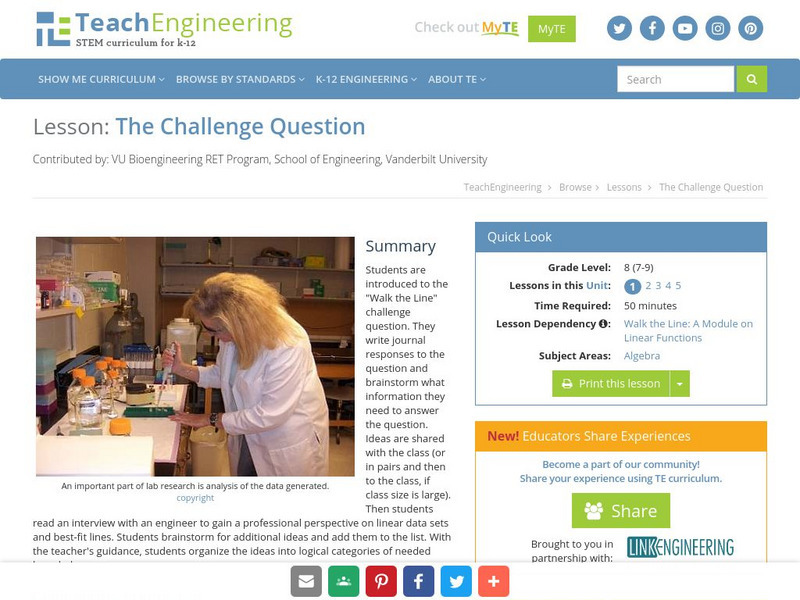
Teach Engineering: The Challenge Question: "Walk the Line"
Students are introduced to the "Walk the Line" challenge question. They are asked to write journal responses to the question and brainstorm what information they need to answer the question. Ideas are shared with the class (or in pairs...
TeachEngineering
Teach Engineering: Coordinates and the Cartesian Plane
A brief refresher on the Cartesian plane includes how points are written in (x,y) format and oriented to the axes, and which directions are positive and negative. Then students learn about what it means for a relation to be a function...
TeachEngineering
Teach Engineering: Graphing Equations on the Cartesian Plane: Slope
The lesson teaches learners about an important characteristic of lines: their slopes. Slope can be determined either in graphical or algebraic form. Slope can also be described as positive, negative, zero or undefined. Students get an...
TeachEngineering
Teach Engineering: Forms of Linear Equations
Students learn about four forms of equations: direct variation, slope-intercept form, standard form and point-slope form. They graph and complete problem sets for each, converting from one form of equation to another, and learning the...
TeachEngineering
Teach Engineering: Applications of Linear Functions
This lesson plan culminates the unit with the Go Public phase of the legacy cycle. In the associated activities, students use linear models to depict Hooke's law as well as Ohm's law. To conclude the lesson plan, students apply they've...
Texas Education Agency
Texas Gateway: Solving Systems of Equations With Algebraic Methods
Given verbal and/or algebraic descriptions of situations involving systems of two-variable linear equations, the student will solve the system of equations by different methods.
Utah Education Network
Uen: 1st Grade Act. 14: Who's in Your Family
This lesson engages students in reading comprehension strategies related to Carol A. Johnson's book, Who's in Your Family. Students will create a classroom graph with the titles of their family members afterward.
Utah Education Network
Uen: Counting on Good Health
This multi-day lesson engages students in exploring healthy habits and components of the food pyramid. Students will describe their favorite foods that will be part of a class tasting party at the end of the days.


![Inside Mathematics: Granny's Balloon Trip [Pdf] Lesson Plan Inside Mathematics: Granny's Balloon Trip [Pdf] Lesson Plan](https://static.lp.lexp.cloud/images/attachment_defaults/resource/large/FPO-knovation.png)
