Curated OER
Sweethearts and Data Analysis
Students explore the concept collecting and representing data. In this collecting and representing data lesson, students record the different colors of sweetheart candies in their sweethearts box. Students create a table of the data and...
Curated OER
Bubble Gum Chemistry
Students explore the concept of graphing data. In this graphing data lesson, students determine the percentage of sugar in bubble gum. Students graph type of gum vs. sugar percentage. Students create a table of their data.
Curated OER
Graph and Compare the Adventure's Temperature Vs. Local Temperature
Students explore the concept graphing data. In this graphing data lesson, students use weather data from their local weather and some other city and graph them. Students plot the local weather vs. another city. Students record...
Curated OER
Creating Bar Graphs
Students create bar graphs based on the names in their family. In this bar graphs instructional activity, students collect the names of the their family members, graph the names into a graphing computer program, and compare the data with...
Curated OER
Tim and Pat - At the Store
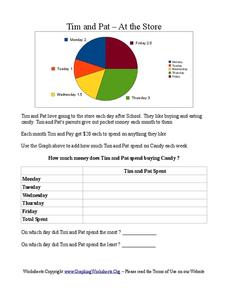
In this pie chart worksheet, students use the pie chart to add the amount of time Tim and Pat spend buying candy each day of the week. Students answer 2 questions about the table.
Curated OER
Jim, Tony, and Frank - The School Fundraiser
In this bar graph worksheet, students use the horizontal bar graph to count how much money each student collected for their fundraiser. Students answer 10 questions.
Curated OER
The Bread Shop
In this bar graphs worksheet, students study the bar graph to count the money Adam made during each day. Students answer 10 questions.
Curated OER
Cindy and Linda - Selling Lemonade
In this pie charts activity, students use the pie chart to count how many glasses of Lemonade were sold by Cindy and Linda. Students complete the table and answer 3 questions.
Curated OER
Tim and Pat - At the Store
In this bar graphs worksheet, students use the bar graph to add how much time Tim and Pat spend buying candy each week. Students complete the table and answer 3 questions.
Curated OER
Jim, Tony and Frank - The School Fundraiser
In this bar graphs learning exercise, students use the bar graph to count how much money kids collected during a weekend fundraiser. Students answer 10 questions.
Curated OER
Graphs
In this Cartesian coordinate plane worksheet, students analyze 4 ordered pairs and locate the place that goes with that point on a graph. Students also write the ordered pair for 4 places shown on the graph. Note: One of the places is a...
Curated OER
Santa's List Sums (J2)
In this Christmas math worksheet, learners help Santa find the number of children on the 17 streets by adding the number of boys and girls in each line of the chart.
Curated OER
Graph Functions: Practice
In this graph functions learning exercise, students complete several activities to help them graph functions. Students use the table and the graph to complete the questions. Students also answer two test prep questions.
Curated OER
Birthday Graph
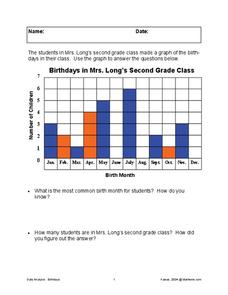
For this graphing worksheet, students interpret a graph of "birthdays in Mrs. Long's second grade class" to answer 2 related questions.
Curated OER
Leaf Worksheet
In this leaf classification learning exercise, students count the number of leaves and write the number in the color column for each day leaves were collected. Students then answer the four questions.
Curated OER
Good Weather
In this graphing data worksheet, students complete a temperature chart and then answer two questions about the weather for that week.
Curated OER
Graphs
In this math worksheet, learners practice the activity that is directed by the teacher. The graph is filled with the data and titled at the top of the page.
Curated OER
Telephone Time
In this telephone time worksheet, students study, discuss and compare two sets of data when represented on the same graph. Students set up an original graph.
Curated OER
Numeracy Practice- Going Out For Lunch
In this math worksheet, students complete the various types of activities that include graphs, data tables, and completing number sentences.
Curated OER
Graphing Grid
In this graphing worksheet, students are given a blank graph to fill in with their own information. Four columns are included, each consisting of six boxes.
Curated OER
Color Survey
In this mathematical worksheet, students survey twenty people to find out what their favorite color is and then graph out their findings.
Curated OER
Which is Your Favorite Dr. Seuss Book?
In this student survey worksheet, students gather information on classmates' favorite Dr. Seuss books. Students use a second worksheet to graph the results of their surveys.
Curated OER
Spotlight on Students
First graders participate in social skills activities at the beginning of they school year that including graphing work. Each student acts as the "Top Banana" while other students ask them questions about their likes and dislikes. As a...
Curated OER
Figuring in Football
Students identify and visualize congruent and similar two-dimensional geometric figures. They recognize that rotations, translations, and reflections do not change geometric figures. Students participate in activites in which they...


