Hi, what do you want to do?
Better Lesson
Better Lesson: What Is Your Favorite Little Bear Story?
SWBAT create a bar graph to match a data set. SWBAT analyze the graph for 3 pieces of information.
Better Lesson
Better Lesson: What Playground Toy Should the Principal Buy for Us
SWBAT use a graph as evidence in a persuasive letter. SWBAT evaluate statements to determine which statement is true, citing evidence in the graph.
Better Lesson
Better Lesson: What Is Your Favorite Snack?
SWBAT use graphs to analyze whether a statement is true or false. SWBAT use graphs as evidence for a persuasive letter.
Better Lesson
Better Lesson: Greedy Gordy Can't Decide Working With Venn Diagrams
Students have been working with pictographs and bar graphs. Now they take their learning a step further by working with Venn Diagrams.
Better Lesson
Better Lesson: Would You Rather Be a Kid or a Grown Up?
Would you rather be a kid or a grown up? This question interests students and engages them in an interesting graphing exercise focused on how many total data points there are in a graph.
Better Lesson
Better Lesson: Super Sorter! Multiple Attribute Sorting With a Venn Diagram
Understanding multiple attributes is an important mathematical process. The students use their knowledge of Venn Diagrams in this lesson to gain more knowledge about this concept.
Better Lesson
Better Lesson: Graphing Using a Frequency Table
Multiple graphs can represent the same data set and make the information easier to understand.
CK-12 Foundation
Ck 12: Precalculus Concepts 2.0
A complete high school Precalculus Concepts course. Includes 'Related Modalities' for each lesson that teach the same concept in different ways. The text materials follows Algebra II and comes before Calculus or Statistics. The content...
Khan Academy
Khan Academy: Adding Probabilities
Find four probabilities for each problem: P(A), P(B), P(A and B), and P(A or B).
Better Lesson
Better Lesson: Something's Fishy Working With Bar Graphs
In this lesson, students continue to build their graphing skills. This lesson also reinforces important mathematical skills like counting and comparing.
CK-12 Foundation
Ck 12: 6.8 Comparing Two Groups
This lesson applies the principals of hypothesis testing to situations involving two samples. It identifies situations with different types of samples, and explores how to test hypotheses about the difference of proportions or means...
CK-12 Foundation
Ck 12: Algebra Ii: 6.6 the T Test
Learn about a statistical test that is used to compare the means of two groups, the T Test.
CK-12 Foundation
Ck 12: Algebra Ii: 6.5 Confidence Intervals
Explore the idea of a confidence interval where it is easier to predict that an unknown value will lie somewhere within a wide range, than to predict it will occur within a narrow range.
US Department of Education
Nces: Kids' Zone: Chances
Dice game allows you to see how increasing or decreasing the number of dice rolls affects an outcome.
Louisiana Department of Education
Louisiana Doe: Louisiana Believes: Eureka Math Parent Guide: Statistics
A guide to support parents as they work with their students with statistics.
Other
Nearpod: Displaying Data: Dot Plots
In this instructional activity, students will learn how to create and intrepret dot plots.
University of Wisconsin
University of Wisconsin: Measures of Central Tendency
This resource provides information about measures of central tendency.
Centers for Disease Control and Prevention
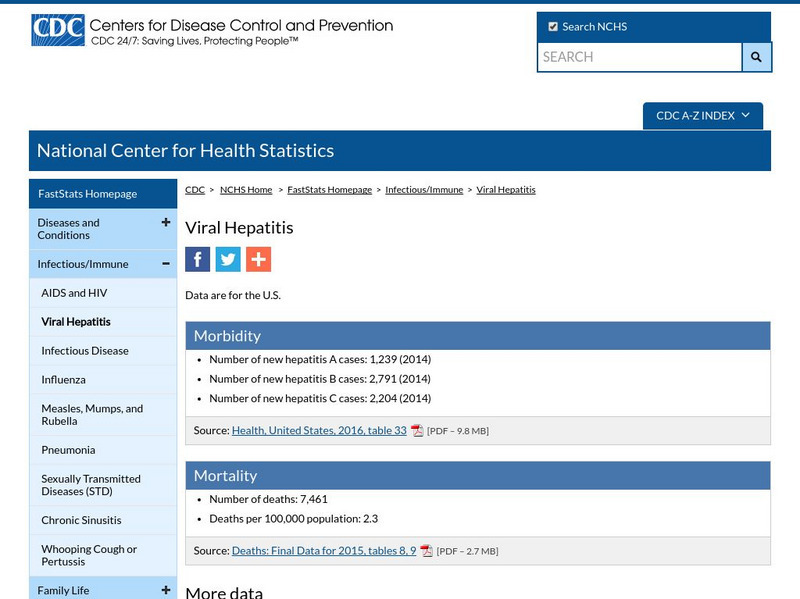
Centers for Disease Control: Nat. Center for Health Statistics: Hepatitis Statistics
National Center for Health Statistics provides major statistics for viral hepatitis. Includes Overall cases in the U.S. and related deaths.
Hofstra University
Hofstra University: Review Exercises Random Variables..
Interactive review problems are offered to practice the concepts of random variables and statistics. Topics covered include, Bernoulli trials, normal and binomial distributions, Chebyshev's rule, and the like.
National Council of Teachers of Mathematics
The Math Forum: Urban Systemic Initiative/oceans of Data
This site includes questions related to reading and understanding graphs. There are links on this site to lesson plans, benchmarks, and other webpages all of which mostly center about probability and statistics.
National Council of Teachers of Mathematics
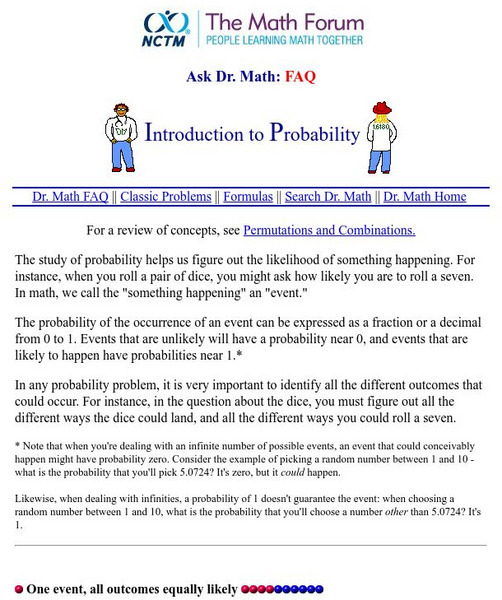
The Math Forum: Ask Dr. Math; Introduction to Probability
A good introduction to concepts in probability, this page also gives a great definition of sample space. Scroll down halfway to find sample space.
Richland Community College
Richland Community College: Probability Definitions
This site, which is provided for by the Richland Community College, gives a list of probability definitions.
Shodor Education Foundation
Shodor Interactivate: Stats and Probability Concepts
Many topics on Statistics and Probability are defined and linked here. Click on any of them to move to a more detailed discussion of the term.
Richland Community College
Richland Community: Introduction to Applied Statistics
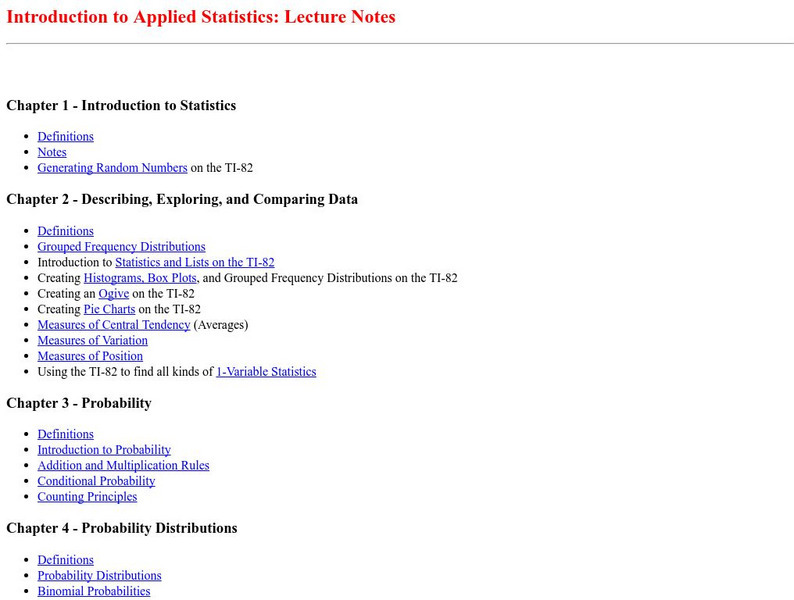
This site from the Richland Community College provides lecuture notes from a class neatly organized and easy to read. Has some good information.


