Hi, what do you want to do?
Duke University
Connected Curriculum Project: Matrix Operations: Part 3: Special Matrices
This site explores the properties of several different types of matrices.
University of Baltimore
University of Baltimore: Statistical Data Analysis: Outlier Removal
Outliers are data items which lie very far below or very far above the "majority" of the data in a set. Here you will find the steps to take to correctly identify whether a data set has outliers as well as how to remove them. Written by...
CK-12 Foundation
Ck 12: Algebra: Applications of Function Models
[Free Registration/Login may be required to access all resource tools.] In this lesson students draw a scatter plot of data, find and draw the function that best fits that data, and make predictions from that information. Students watch...
Rice University
Hyper Stat Online Statistics Textbook: Chapter 3: Describing Bivariate Data
This chapter of an online textbook begins with a description of scatterplots, then focuses on the Pearson Product Moment Correlation.
University of North Carolina
University of North Carolina Writing Center Handouts: Statistics
When presenting an argument, the use of statistics to support a point can be very effective. This handout offers advice on both how to read statistics so that you understand exactly what they mean, and how to use them in your argument so...
National Council of Teachers of Mathematics
The Math Forum: Drexel Math Forum: Adventures in Statistics
This lesson plan incorporates problem-solving and data collection to satisfy a fifth grade class's curiosity about the size of their classroom with respect to a sixth grade classroom.
National Council of Teachers of Mathematics
The Math Forum: Traffic Jam Activity Lesson Plan
There are seven stepping stones and six people - three on the left facing the three on the right. How is it possible to have the three on the left end up on the right, and vice versa, while everyone was at all times standing on a stone...
Sophia Learning
Sophia: Supporting Details Explained
This slideshow focuses on supporting details; it discusses their purpose, the audience, and the point to be made. It lists the five most common types of supporting details: facts, statistics, opinions, examples, and personal observations...
University of Arizona
Pulse: Powerful Explorations of Health and Energy
A cross curricular unit where students simulate an energy task meeting to discuss protecting human health through energy policies. The unit covers content for twelfth grade in math, physics, language arts, and government. Topics reviewed...
US Mint
U.s Mint: Which Side Is Which [Pdf]
Introduce students to the Louisiana Purchase and Lewis and Clark's Expedition. Then take a look at the Peace Medal nickel and differentiate between heads and the tails sides. Finally, do a coin-flip activity, and record and analyze the...
Northern Illinois University
The Mathematical Atlas: Probability Theory and Stocha
This site from the Northern Illinois University gives general background information on probability and also includes books and other websites that contain information on Probability.
Other
Stat Trek: Two Way Tables
This website provides students instruction on how to construct and interpret two-way tables.
University of Illinois
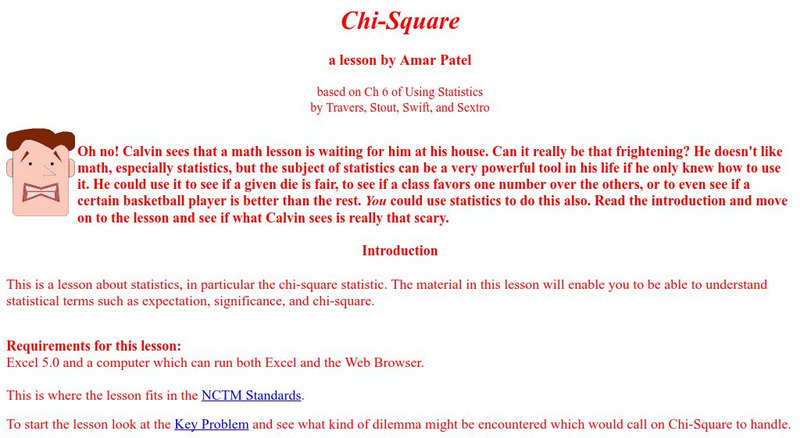
University of Illinois: Chi Square
A lesson giving problems that explains how to use chi-square statistics. Lesson includes several key problems that ensure student's understanding of statistical terms.
Other
Lookups
Search the U.S. for information you might need or want just for the fun of it. Look up everything from addresses, zip codes, distances, phone numbers, radio stations, schools, labor statistics, crime statistics, demographics, and much...
University of Cambridge
University of Cambridge: Maths and Sports: Match the Matches
Decide which charts and graphs represent the number of goals two football teams scored in fifteen matches. This data handling activity is designed to get children talking meaningfully about mathematics, presenting and justifying...
Shmoop University
Shmoop: Using Probability to Make Decisions Hss md.b.7
A description of the standard, analyze decisions and strategies using probability concepts, in addition to sample questions and aligned resources.
Khan Academy
Khan Academy: Eyeballing the Line of Best Fit
Students practice informally graphing a line of best fit to a scatter plot and answer questions to determine if a scatter plot has a correlation. Students receive immediate feedback and have the opportunity to watch a video, get hints,...
Other
The Sports Network
The Sports Network is a truly comprehensive sports-centered website. Covering sports throughout the world, content includes the latest headlines and scores, as well as focused looks at all major (and minor) professional sports, college...
Texas Instruments
Texas Instruments: Numb3 Rs: The Pythagorean Expectation
Based off of the hit television show NUMB3RS, this interesting lesson has students use sabermetrics (the study of statistics in baseball) to determine the expected winning percentage for a team, given the runs scored and runs allowed....
Texas Instruments
Texas Instruments: Numb3 Rs: Is It for Real?
Based off of the hit television show NUMB3RS, this lesson uses sabermetrics (study of statistics of baseball) to try to determine when certain players had "change points," or times when their performance drastically changed. This is done...
Illustrative Mathematics
Illustrative Mathematics: S Id, F if Laptop Battery Charge
This task uses a situation that is familiar to young scholars to solve a problem they probably have all encountered before: How long will it take until an electronic device has a fully charged battery? Given data, students perform a...
Illustrative Mathematics
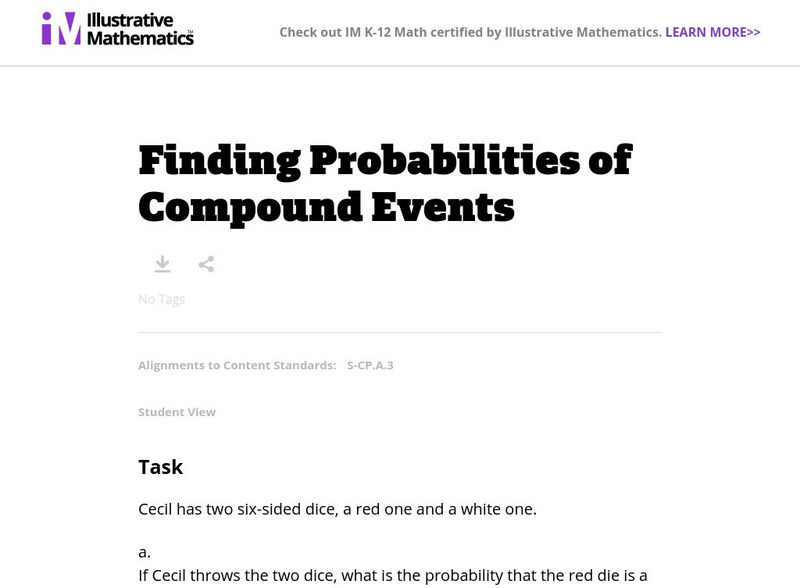
Illustrative Mathematics: S cp.a.3: Finding Probabilities of Compound Events
Cecil has two six-sided dice, a red one and a white one. Aligns with S-CP.A.3.
Illustrative Mathematics
Illustrative Mathematics: 6.sp.1 Identifying Statistical Questions
A task asking students to determine which of the seven questions listed are statistical questions and which are not.
Illustrative Mathematics
Illustrative Mathematics: 6.sp Buttons: Statistical Questions
A task asking students to determine which of the six questions listed are statistical questions and which are not. Students are then asked to write a statistical question of their own.




![U.s Mint: Which Side Is Which [Pdf] Lesson Plan U.s Mint: Which Side Is Which [Pdf] Lesson Plan](https://content.lessonplanet.com/knovation/original/249033-ff1ff264a293b5ffb6c4bba64baec78d.jpg?1661243090)

