Massachusetts Institute of Technology
Mit: Blossoms: Why Pay More?
This lesson is an introduction to Multiple Regression Analysis or MRA, a statistical process used widely in many professions to estimate the relationship among variables. The aim of this video is to make it easier for students to...
Virtual Nerd
Virtual Nerd: How Do You Use a Scatter Plot to Find a Line of Fit
In this video lesson students learn how to graph data on a coordinate plane and draw a line of fit for that data.
Khan Academy
Khan Academy: Video Games and Violence
In this video lesson students look at a set of data, transfer the data into a two-way table and then use that table to make inferences about the data.
Virtual Nerd
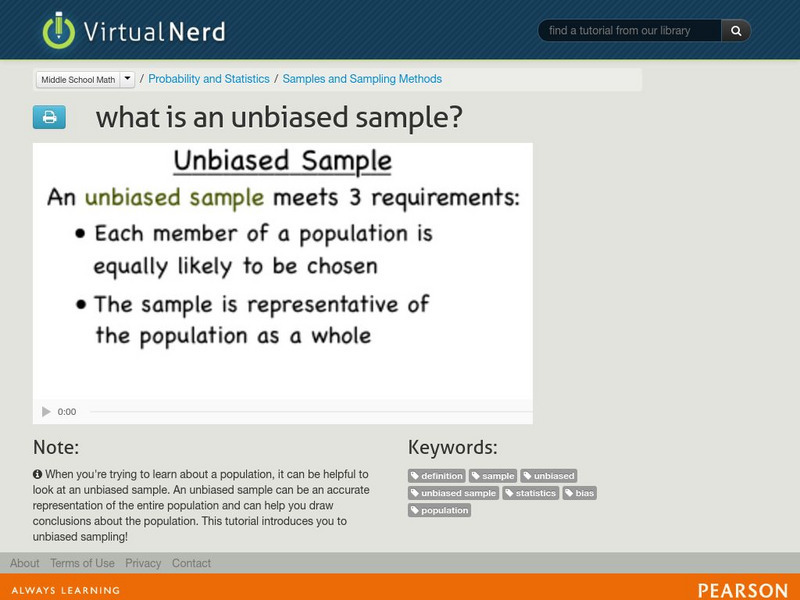
Virtual Nerd: What Is an Unbiased Sample?
When you are trying to learn a particular characteristic of a large population, you need to be able to study an unbiased sample of that population to be able to draw accurate conclusions. Watch this video for an in-depth explanation. [5:04]
Massachusetts Institute of Technology
Mit: Blossoms: Probability Theory
The main objective of this lesson is to motivate students' thoughts and get them excited about some probability concepts. The aim is to present probability theory in as simple a manner as possible. It is hoped that students will learn...
PBS
Pbs Learning Media: Real Life Math: Baseball
Watch and listen as the assistant general manager of a major league baseball team explains how he uses math in this video from KAET, Arizona PBS. A lesson plan and handouts are included. [7:43]
Sophia Learning
Sophia: Simple Random Samples
This tutorial explains simple random samples. Students can watch a video and then take a quiz to test their understanding.
TED Talks
Ted: Ted Talks: Hans Rosling Shows the Best Stats You've Ever Seen
In this video, Hans Rosling examines available data from data bases that demonstrate global life expectancies, world wealth, GDP and child death, and how we can use this data. He focuses on the need for "publicly funded data" so that...
Virtual Nerd
Virtual Nerd: What Is a Line Plot?
A line plot shows the frequency of categorical data. Take a look at this tutorial to learn more. [4:44]
Virtual Nerd
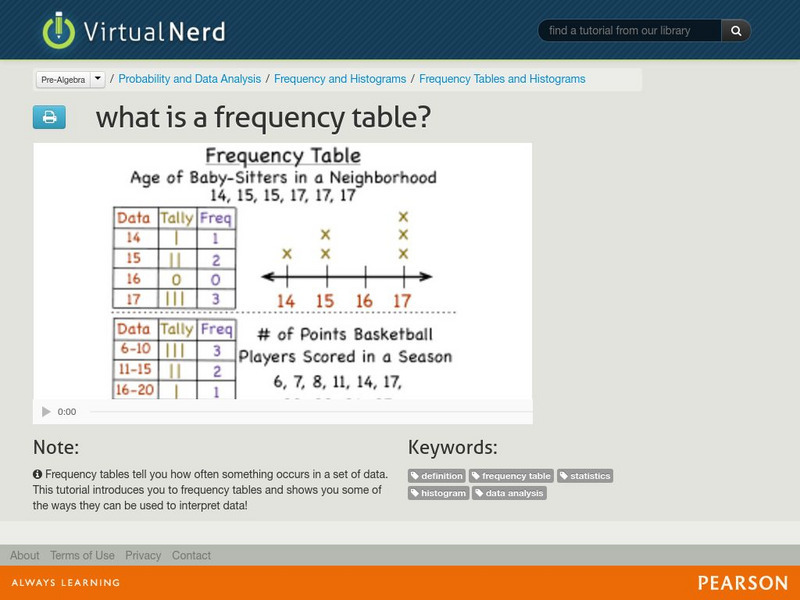
Virtual Nerd: What Is a Frequency Table?
Video serves as an introduction to frequency tables which tell you how often something occurs in a set of data. [6:44]
Virtual Nerd
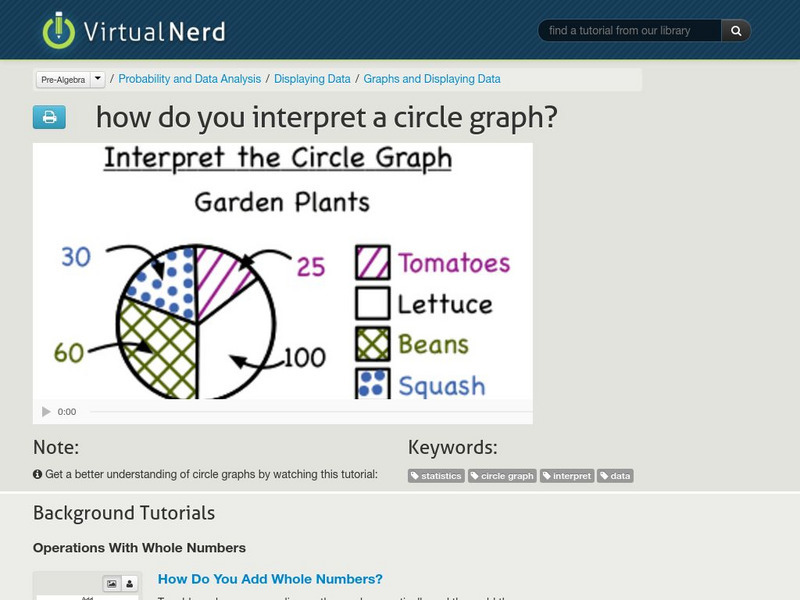
Virtual Nerd: How Do You Interpret a Circle Graph?
Gain an understanding of circle graphs by watching this tutorial. [3:59]
Virtual Nerd
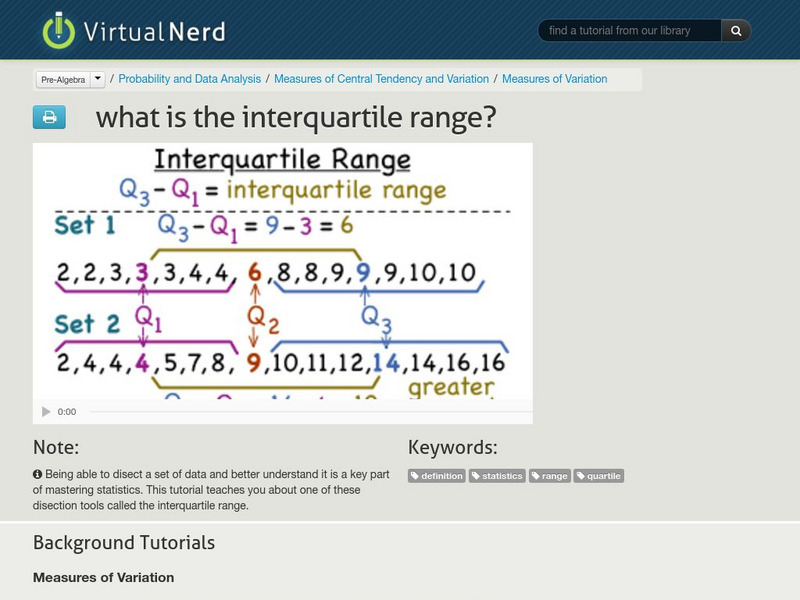
Virtual Nerd: What Is the Interquartile Range?
This tutorial teaches about one of the ways to dissect a set of data called the interquartile range. [4:34]
Virtual Nerd
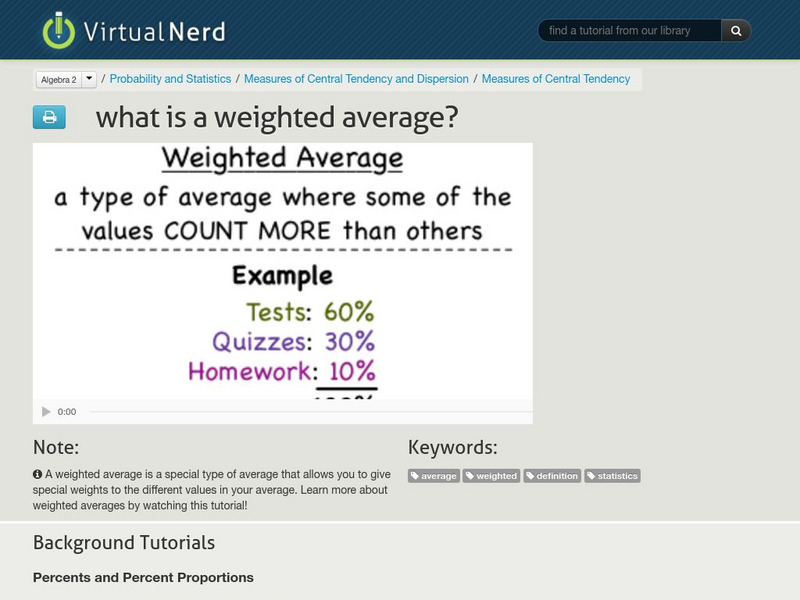
Virtual Nerd: What Is a Weighted Average?
Watch this tutorial to learn about weighted averages, a special type of average that allows you to give special weights to the different values in your average. [3:06]
Virtual Nerd
Virtual Nerd: How Do You Find Relative Frequency?
Relative frequency is how often something happens divided by all the outcomes. Watch this tutorial to learn all the steps needed to find the relative frequency. [3:25]
Khan Academy
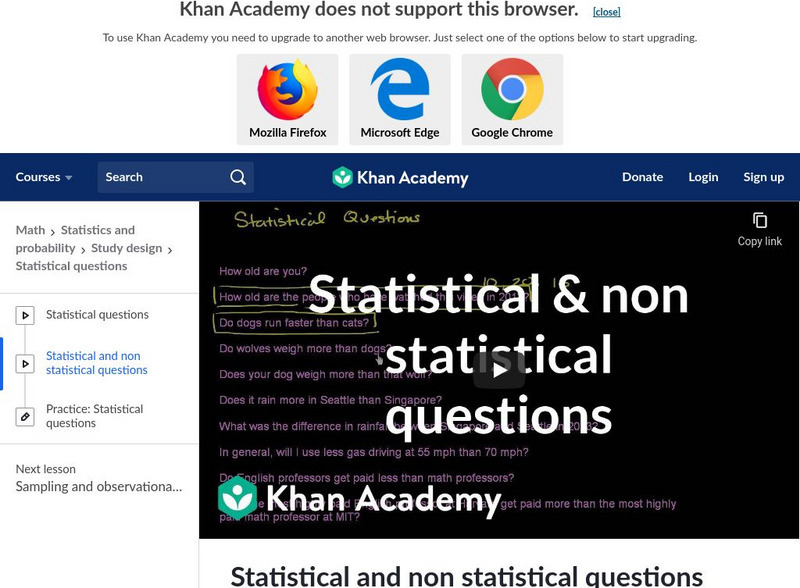
Khan Academy: Statistical and Non Statistical Questions
Looks at the types of questions that statistics can address and explains how to tell the difference between a statistical and a non-statistical question. [7:50]
Khan Academy
Khan Academy: Confident Intervals: Small Sample Size Confidence Intervals
Constructing small sample size confidence intervals using t-distributions.
Khan Academy
Khan Academy: Statistics: The Average
Introduction to descriptive statistics and central tendency. Gives demonstration of how to find arithmetic mean, median and mode of a set of numbers.
Sophia Learning
Sophia: Drawing Histograms
Explore how to represent data on a histogram. Check understanding with quiz.
Sophia Learning
Sophia: Finding Mean, Median, and Mode
Solve for the mean, median, and mode when given a data set. Assess learning with a quiz.
Sophia Learning
Sophia: Finding the Mean of a Set of Data
This video lesson demonstrates how to calculate the mean for a set of data. Students can check their understanding with an assessment.
Sophia Learning
Sophia: Getting I Nformation Out of Stem and Leaf Plots
Use stem-and-leaf plots to determine the mean, median, mode, and least and greatest values. Take quiz to check understanding.
Sophia Learning
Sophia: Graphing Scatter Plots
Use collected data to graph scatter plots on a coordinate plane. Take quiz to check understanding.
Sophia Learning
Sophia: Graphing Scatter Plots
Create a scatter plot by displaying data on a coordinate plane. Assess understanding with a quiz.
Sophia Learning
Sophia: Histogram Tutorial
Determine when to use and how to display data using a histogram.


