Hi, what do you want to do?
Curated OER
What is Weather Like in Fall And Winter?
In this seasons worksheet, students will write or draw what the weather is like during each of the 4 seasons in this graphic organizer.
Curated OER
Climate Types
In this weather worksheet, students describe the rainfall distribution found in two different areas of the world. Then they compare the various types of climates found around the world using the graphs shown on the sheet.
Curated OER
Choropleth Mapping Skills
In this geography worksheet, students identify and describe how to apply choropleth mapping skills. They examine the map given and convert it into a choropleth map through coloring. Then students use those colors to shade in their key...
Curated OER
How Wet Did It Get?
Students measure the rainfall/snowfall on the playground on a rainy/snowy day with a rain/snow gauge. They draw a bar graph representing the amount of water that fell and observe a satellite image of the clouds and local weather system...
Curated OER
Measuring Rainfall
Students investigate the amount of rain that falls in their area through the construction and monitoring of a rain gauge. The gauge is observed for one week, recordings are made, and observations described in a chart.
Curated OER
Deserts Puzzle
In this geography worksheet, students complete a crossword puzzle referring all to deserts. They identify the various types of desert land and what plants and animals can survive in these lands. Also, students identify the people who...
Curated OER
Too Much...Or Not Enough?
Students discuss and define flooding. They identify areas in northeast Florida that may flood. Students examine droughts and explain the conditions that cause them. They examine the need for growth management in the state of Florida.
Curated OER
How's the Weather
Students explore weather patterns. They collect and record all aspects of the weather from various sites. Students investigate regional weather and use a spreadsheet to record and chart data. Students chart temperature, humidity,...
Curated OER
FILLING IN THE GAPS - Acquiring and Analyzing Satellite and Ground-Based Data
Students monitor rainfall, compute daily averages, and compare their methods of computation to those used by actual researchers using satellite observations.
Country Studies US
Country Studies: Albania Climate
Seasonal and regional average rainfall and temperature statistical information is given for Albania in this article.
US Geological Survey
Usgs: The Water Science School: Watersheds and Drainage Basins
Understand what watersheds are and the purpose of drainage basins. This is a resource designed to enrich classroom learning about the science of water.
US Geological Survey
Usgs: Water Science for Schools Activities Center
This website offers three activity centers: Questionnaires, Opinion Surveys, and Challenge Questions. Take a look at these interesting water research activities from the US Geological Survey. Click Home to access the site in Spanish.
BBC
Bbc Weather: Algiers, Algeria
Find out about the climate of Algiers, Algeria from this BBC Weather site where you will read about the climate regions, temperature variations, precipitation, and sunshine amounts. There is also a current 5-day forecast for Algiers.
NASA
Nasa Earth Observatory: Global Maps: Total Rainfall
View a global map from NASA's Earth Observatory showing total rainfall from January 1998 to November 2008.
Utah Education Network
Uen: Mapping It Out
Learn about Utah's environments, temperature, elevation, and rainfall.
NASA
Nasa: Precipitation Towers: Modeling Weather Data
This lesson uses stacking cubes as a way to graph precipitation data, comparing the precipitation averages and seasonal patterns for several locations. Variations on the lesson can accommodate various ages and ability levels. Students...
University Corporation for Atmospheric Research
Ucar: Climate & Water Teaching Box
Investigate water in a warmer world. This teaching box is filled with explorations and readings that help secondary students learn how climate change is affecting the water cycle.
Scholastic
Scholastic: How Much Rain in a Rain Forest?
How can you figure out how much rain in a rain forest? This site provides an outline for a lesson plan that will answer this question. Students will have an opportunity to integrate math and science skills through this activity.
Environmental Education for Kids
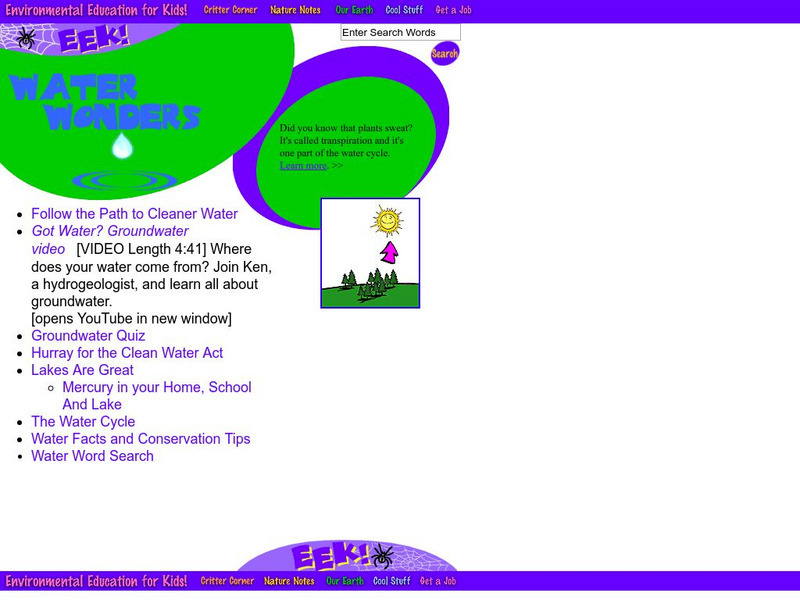
Eek!: Water Wonders
This site from the Environmental Education for Kids contains colorful and detailed information on water resources. Site covers fascinating tips and facts, as well as engaging quizzes on the wonderful world of water. Best suited for...
PBS
Pbs Learning Media: Water Erosion
In this video from Nature, learn about the erosive action of water on the Hawaiian landscape and human efforts to limit it.
Other
World Climate
Find out what the climate is like in thousands of places all over the world. You'll not only get the climate, but the latitude and longitude as well!
Other
Central Vermont Chamber of Commerce: Change Is Weather's Only Constant
This site presents Vermont's weather pattern for a year. This shows the difference in the temperature. When summer hits when they get more rain.
PBS
Pbs Teachers: Weather: Rainfall
Create and use scatterplots based on information from a table, and compare and contrast annual rainfall in various places around the world.
Science Education Resource Center at Carleton College
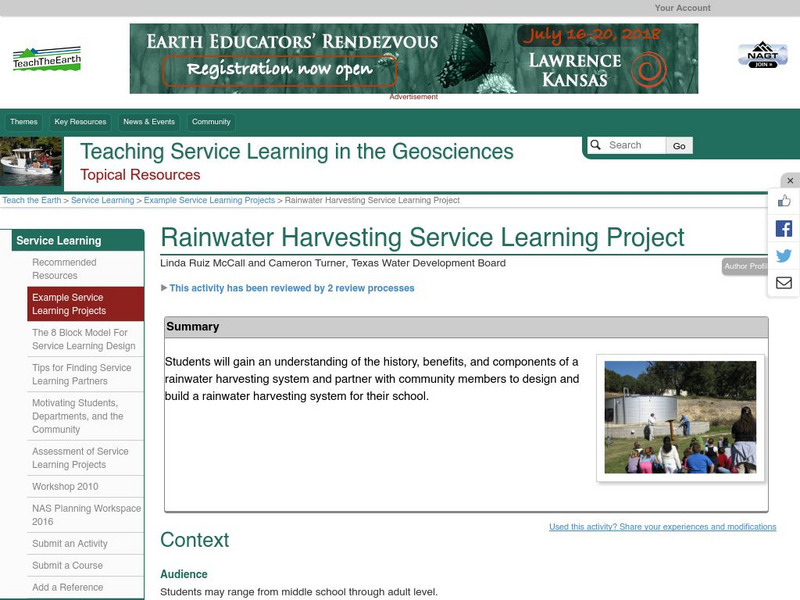
Serc: Rainwater Harvesting Service Learning Project
Students will gain an understanding of a rainwater harvesting system, learn about rainfall patterns and water use for various purposes, then design and build a rainwater collection system for their school.


