Curated Video
Review for You: Representing and Analyzing Data
Mr. Addit reviews multiple ways to represent and analyze data, including tallies, bar graphs, pictographs, and line plots.
Curated Video
How Transportation Developed Cities and Industries
Dr. Forrester talks about how transportation, such as the Wells Fargo stagecoach, influenced the development of cities and industries in the western region.
Curated Video
Review for You: Charts, Graphs, and Plots
Mr. Addit reviews tally charts, pictographs, bar graphs, and line plots.
Makematic
Foot Traffic
People measure all types of things everyday: distances walked, sizes of clothing, quantities of food and time for cooking. In this activity, children aged 3-7 will trace their feet and cut them out to use as non-standard measurements,...
Curated Video
More visitors means more graffiti in Kananaskis
Alberta's park rangers say too many visitors are making unwanted additions to the stunning scenery. Some are leaving graffiti on everything from rocks to trees. CBC Calgary's Dan McGarvey met a ranger in Kananaskis to have a look.
Curated OER
Pictographs and Line Plots - Math Help
Draw a line plot along with the tutor in this super slow video. The tutor speaks extra slow and extra clear so that learners can easily understand the process needed to draw a line plot or pictograph. Send this link home to help learners...
Sophia Learning
Sophia: Ancient Egypt: Lesson 3
This lesson will introduce some of the basic concepts associated with the art and culture of ancient Egypt. It is 3 of 5 in the series titled "Ancient Egypt."
Khan Academy
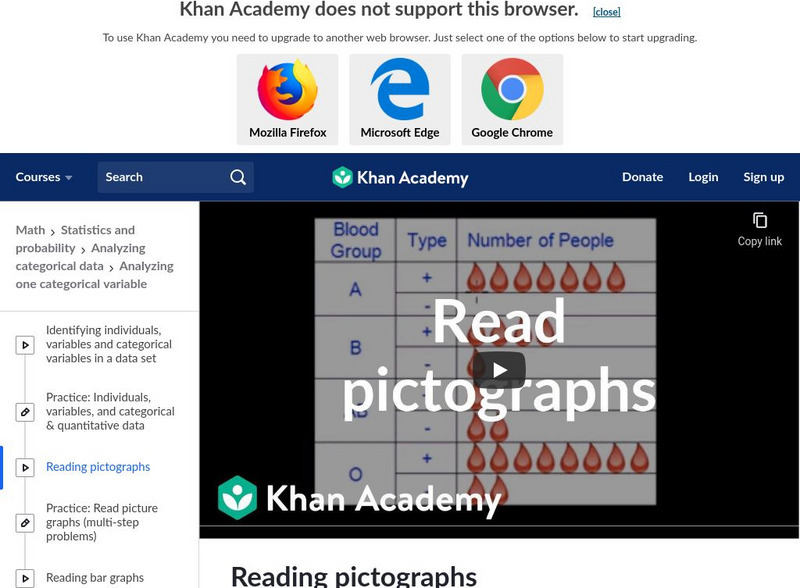
Khan Academy: Reading and Interpreting Data: Reading Pictographs
Video example of reading a pictograph to answer a question including using a scale.
Study Pug
Study Pug: Advantages and Disadvantages of Different Graphs
This lesson discusses the advantages and disadvantages of using different types of graphs to display data, such as pictographs, line graphs, and bar graphs. [3:08]
Sophia Learning
Sophia: Creating a Category Pictograph: Lesson 6
This video lesson [4:02] demonstrates how to construct a category pictograph. It is 6 of 8 in the series titled "Creating a Category Pictograph."
Sophia Learning
Sophia: Creating a Category Pictograph: Lesson 1
This video lesson [4:03] demonstrates how to construct a category pictograph. It is 1 of 8 in the series titled "Creating a Category Pictograph."
Sophia Learning
Sophia: Creating a Quantity Pictograph: Lesson 5
This video lesson [3:46] demonstrates how to create a quantity pictogram. It is 5 of 9 in the series titled "Creating a Quantity Pictograph."
Sophia Learning
Sophia: Creating a Quantity Pictograph: Lesson 1
This video lesson [3:55] demonstrates how to create a quantity pictogram. It is 1 of 9 in the series titled "Creating a Quantity Pictograph."
Sophia Learning
Sophia: Creating a Quantity Pictograph
This video lesson demonstrates how to create a quantity pictogram.
Sophia Learning
Sophia: Creating a Category Pictograph
This video lesson demonstrates how to construct a category pictograph.
Sophia Learning
Sophia: Creating a Category Pictograph
This video lesson demonstrates how to construct a category pictograph.
Sophia Learning
Sophia: Creating a Quantity Pictograph
This video lesson demonstrates how to create a quantity pictogram.
Sophia Learning
Sophia: Creating a Quantity Pictograph
This video lesson demonstrates how to create a quantity pictogram.
Loyola University Chicago
Math Flix: Graphs: Pictogram, Bar Graph & Line Graph
This QuickTime movie provides examples of pictograms, bar graph, and line graph. A pdf worksheet is available by clicking on the hyperlink at the bottom of the page. As you watch and listen to the teacher and student interact it helps...


